Field Notes
Soil data from Kenyan fields, read and interpreted. No second-hand advice.
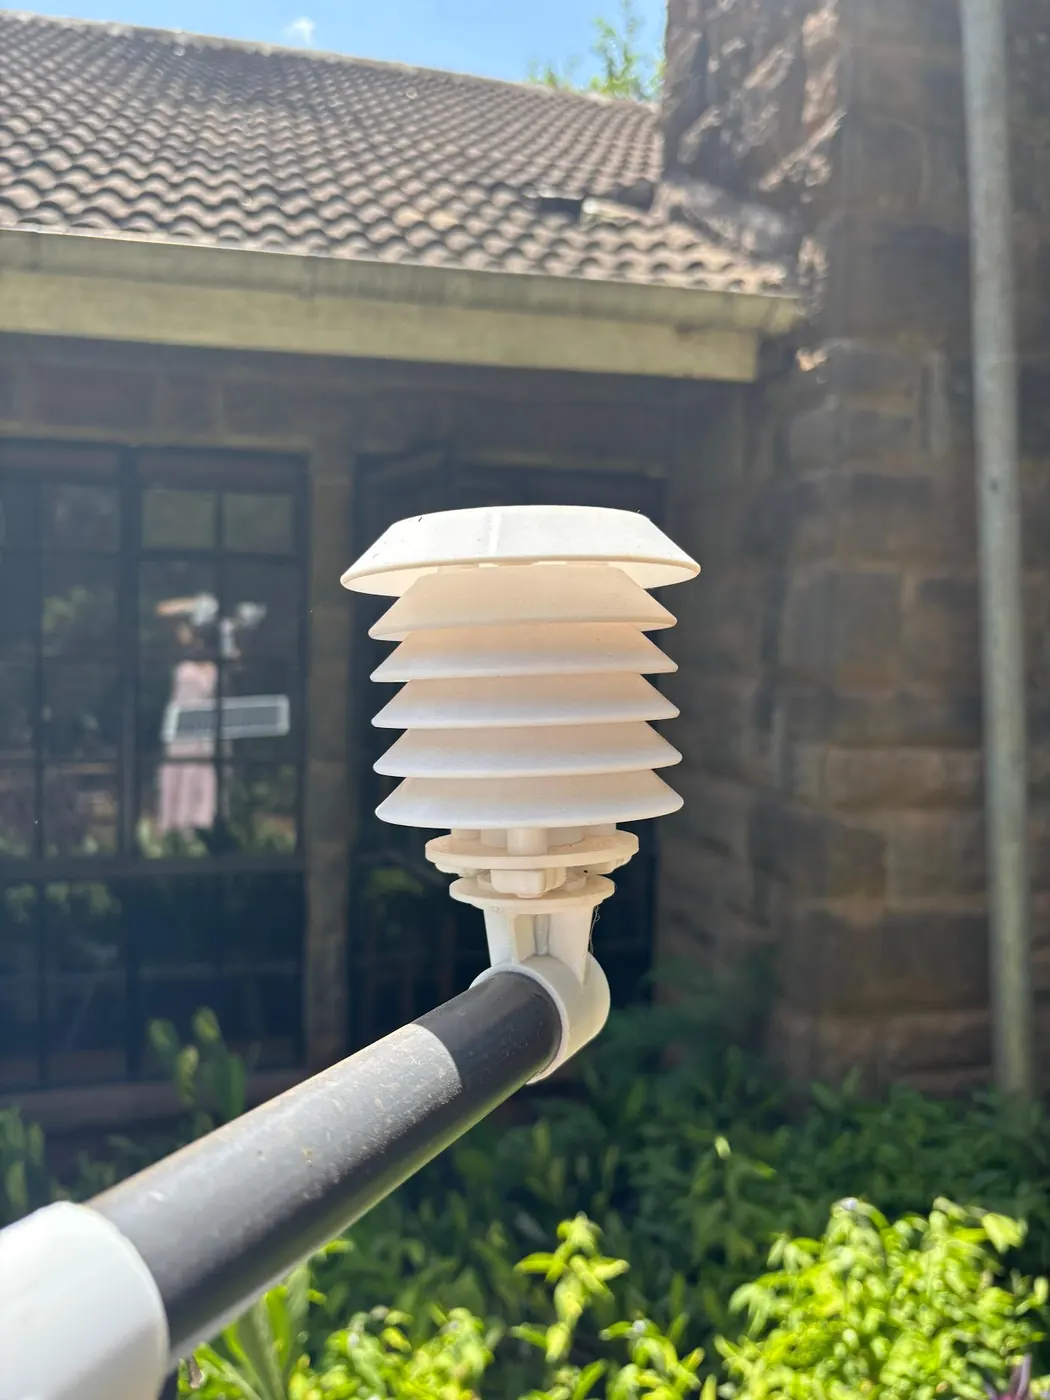
How a capacitive soil moisture sensor works
The number is a position on the probe's own scale, not litres of water in the ground. Two boards from the same batch read differently in the same wet soil, so the calibration matters more than the price of the board.
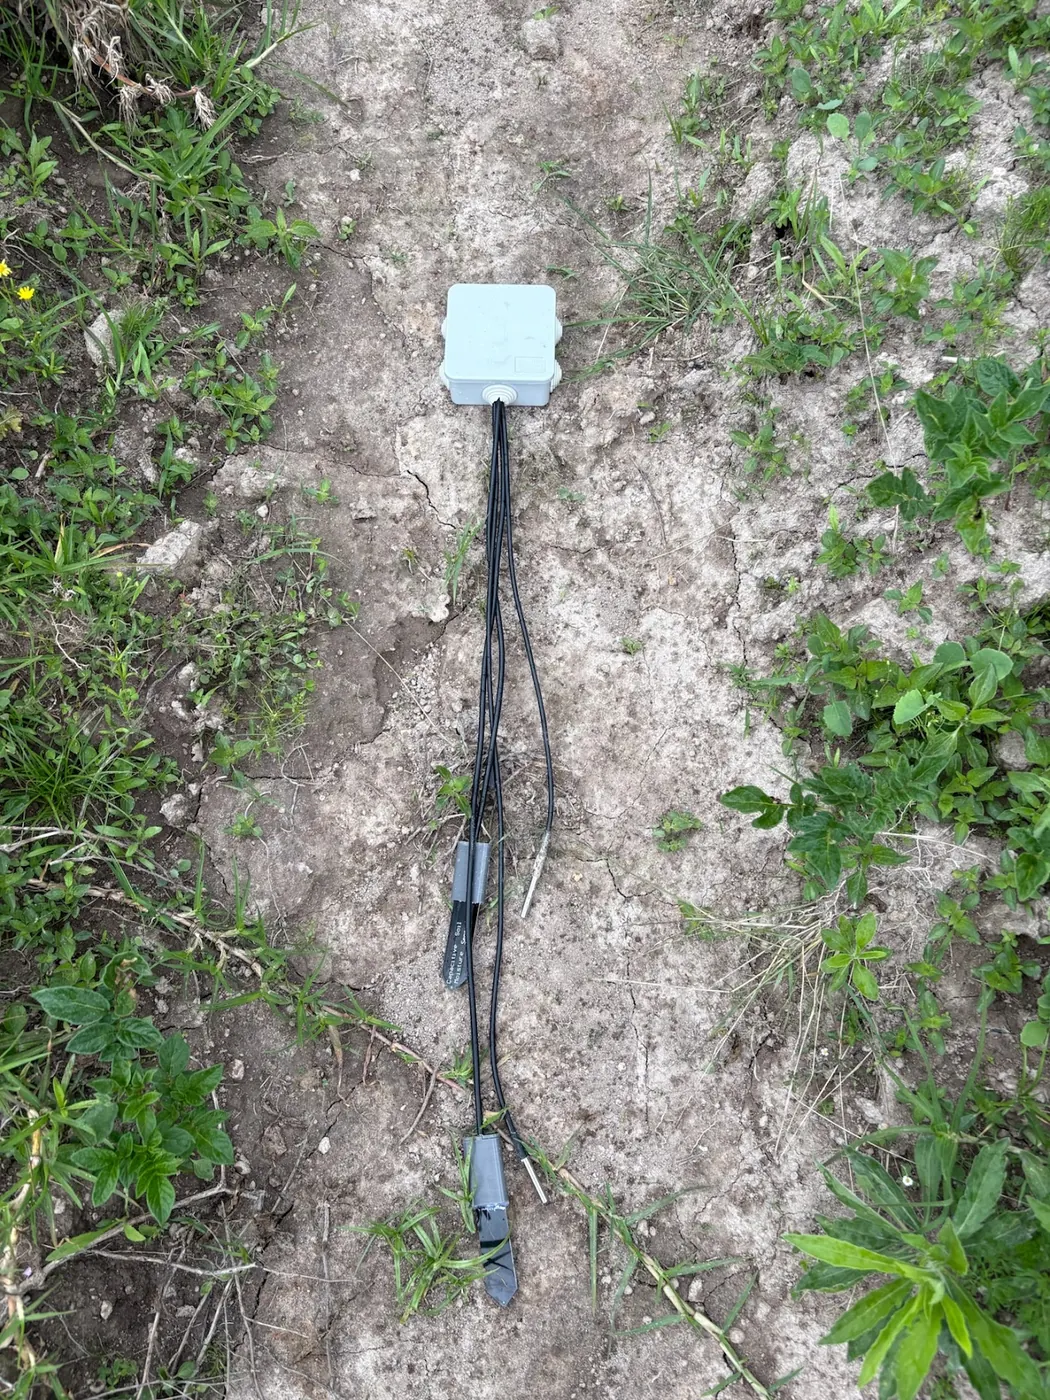
Soil moisture sensor for a Kenyan farm: which type to buy
A tensiometer goes blind above 0.8 bar, so it is the wrong buy on clay. A cheap capacitive probe with a small converter matched the expensive ones in trials. And one probe, however accurate, still reports only one point in the block.
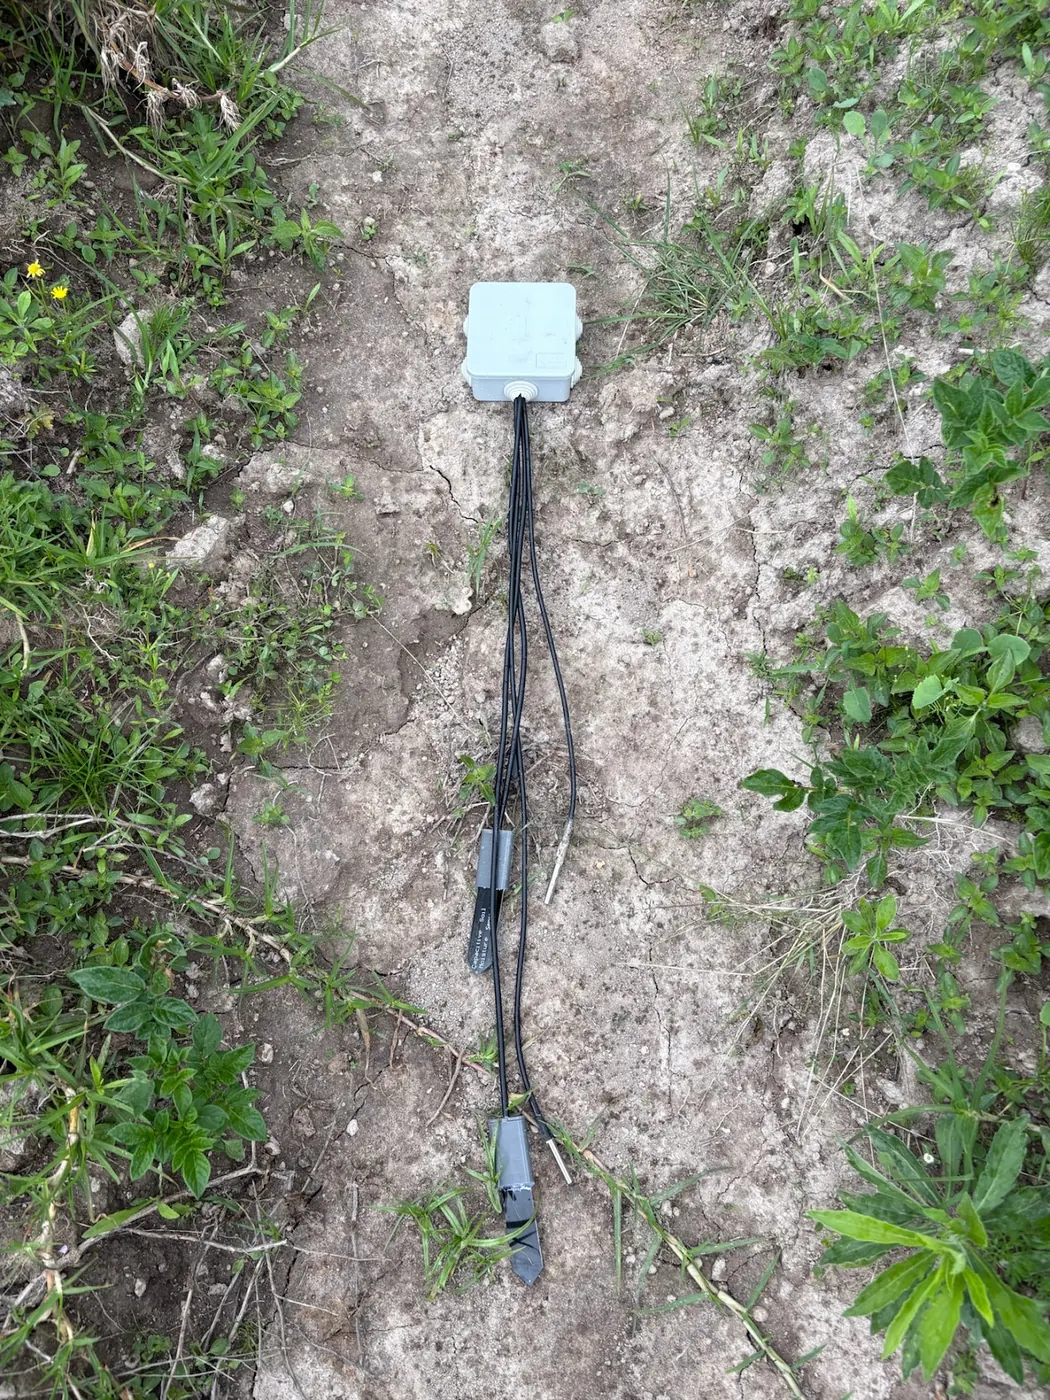
A soil probe reading that looks wrong: air gaps, drift and roots
A flat trace can mean a dead probe, a stuck value or soil that really is steady. Use the temperature channel, the rain record and one oven-dried sample beside the probe to tell which.
Is your borehole water salting the field? How to check
Water at 2 dS/m puts about 4.4 tons of salt per acre on a block over a season, and only drainage takes it out again. Test first, leach on purpose, blend next, and change source only as a last resort.
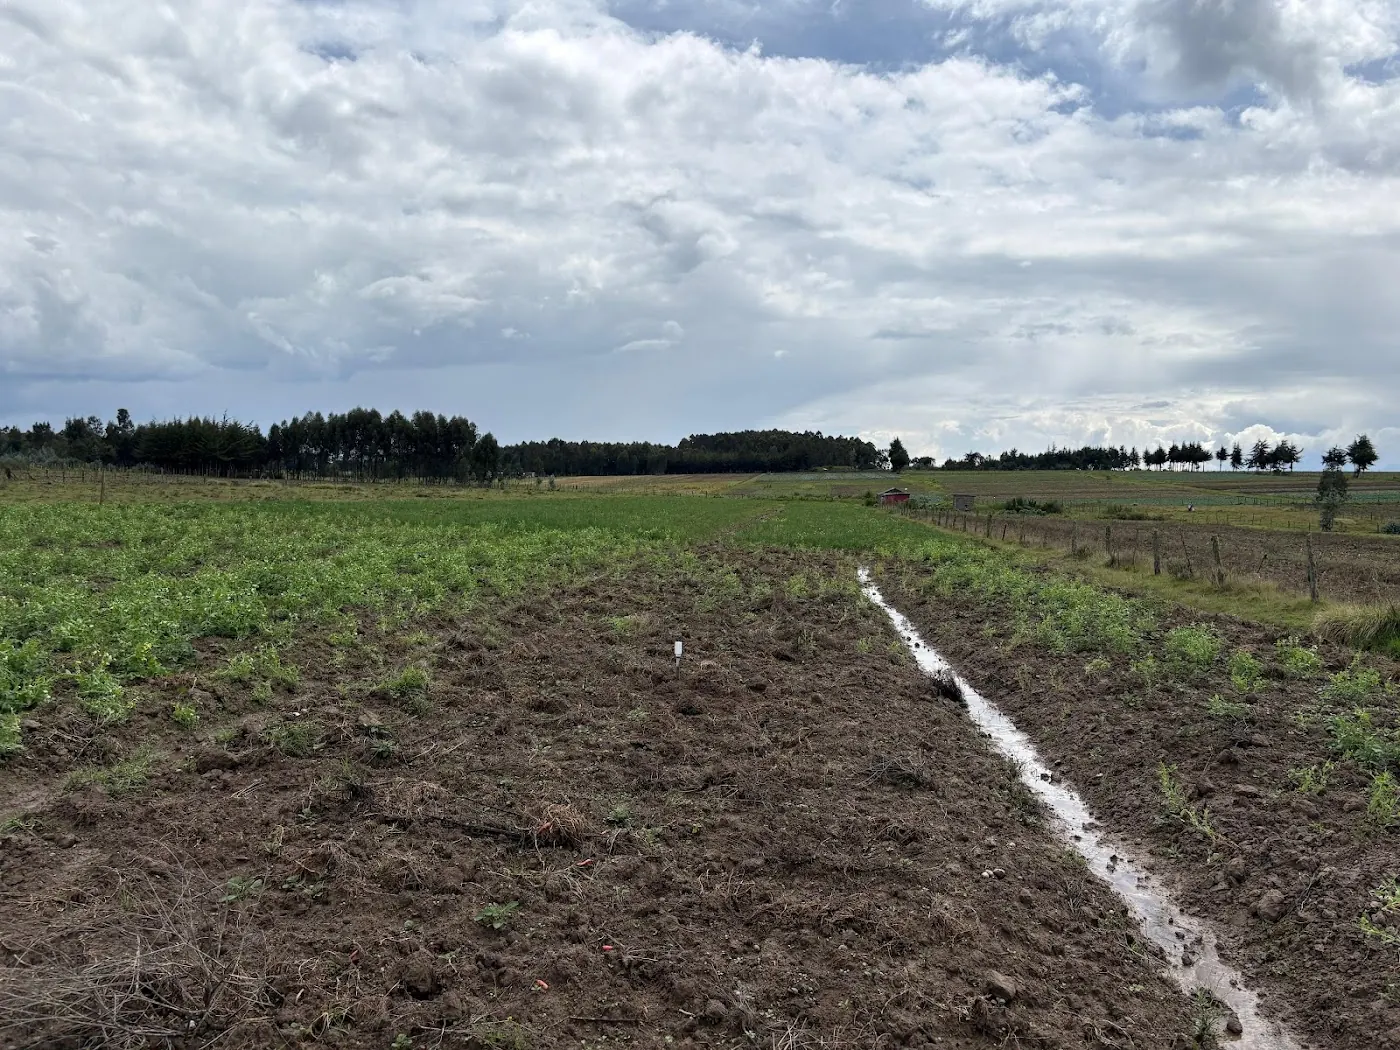
How deep to bury a soil probe, and why two depths beat one
You fix burial depth once, with a spade, and live with it all season. Dig a profile pit first, read the two depths as a pair, and weigh the KES 2,000 gap between a one-depth and a two-depth sensor.
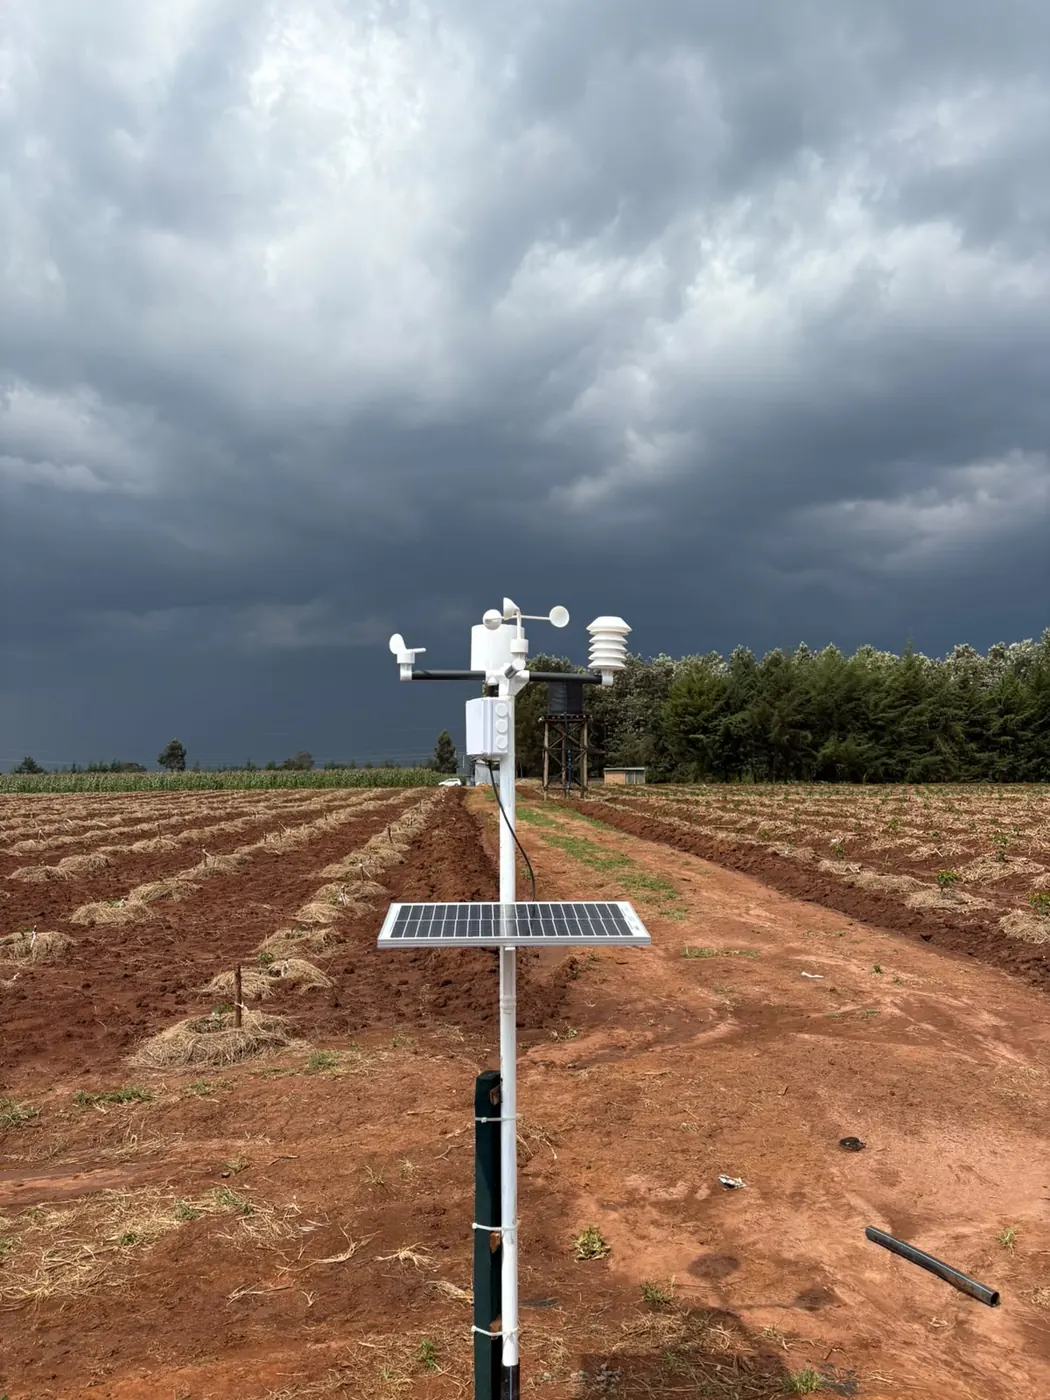
Finding the hardpan under your field, and what it costs you
A deeper probe that stays high and flat after rain can mean water the roots cannot drink. Yield losses in overseas trials ran from 1 to 34 percent, and the damage is worst in a dry season.
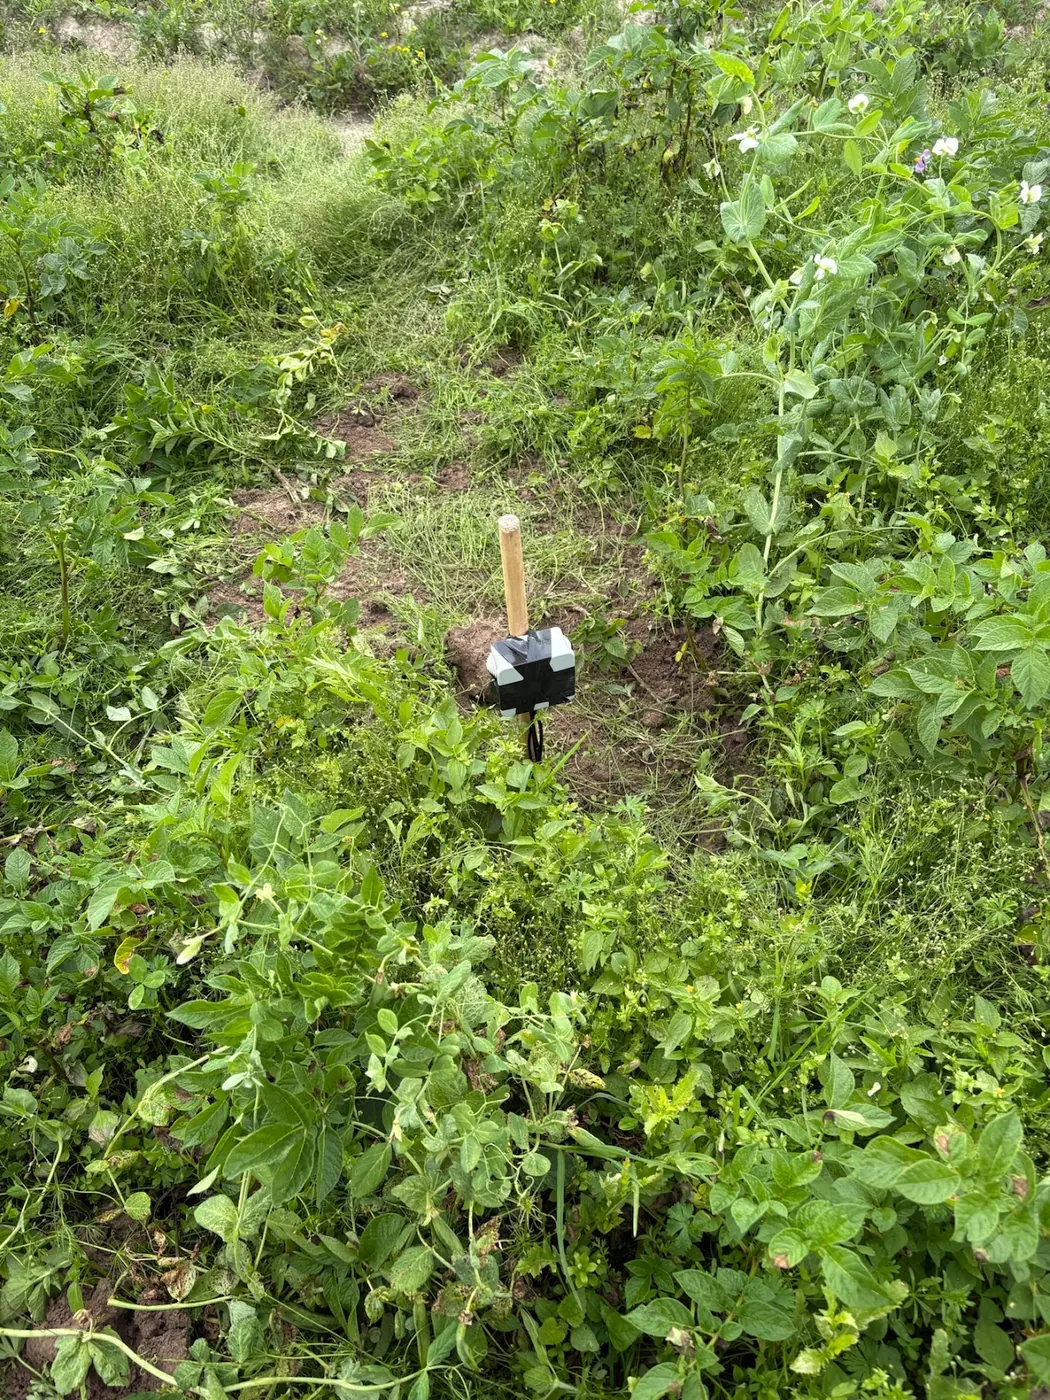
The soil moisture range each crop wants, read off a probe
There is no universal number for how wet a root zone should be: one Nigerian farm read 0 to 49.9 percent on cocoa land and 5.6 to 94.1 percent beside the river, same instrument.
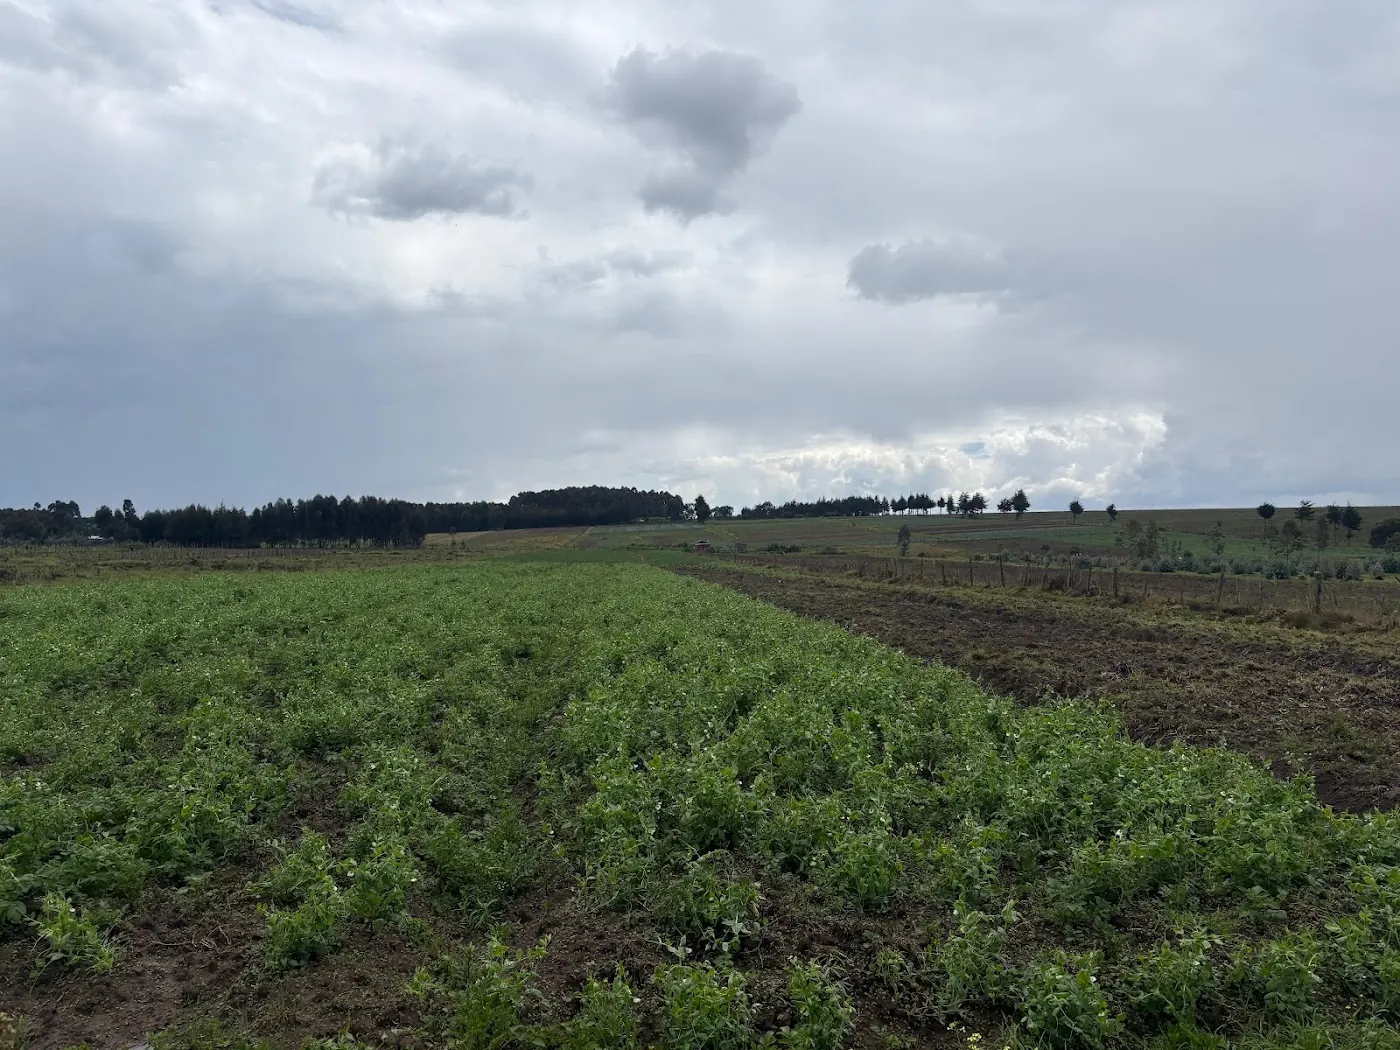
Why your soil pH meter and the lab disagree
Sampling depth, one poke against 8 to 10 mixed cores, the lab's soil-to-water ratio and a drifting electrode each move the number. Seasonal swings alone run 0.3 to 0.5 units. And only the lab's buffer pH can set a lime rate.
Percent of scale or volumetric water content: what your probe reports
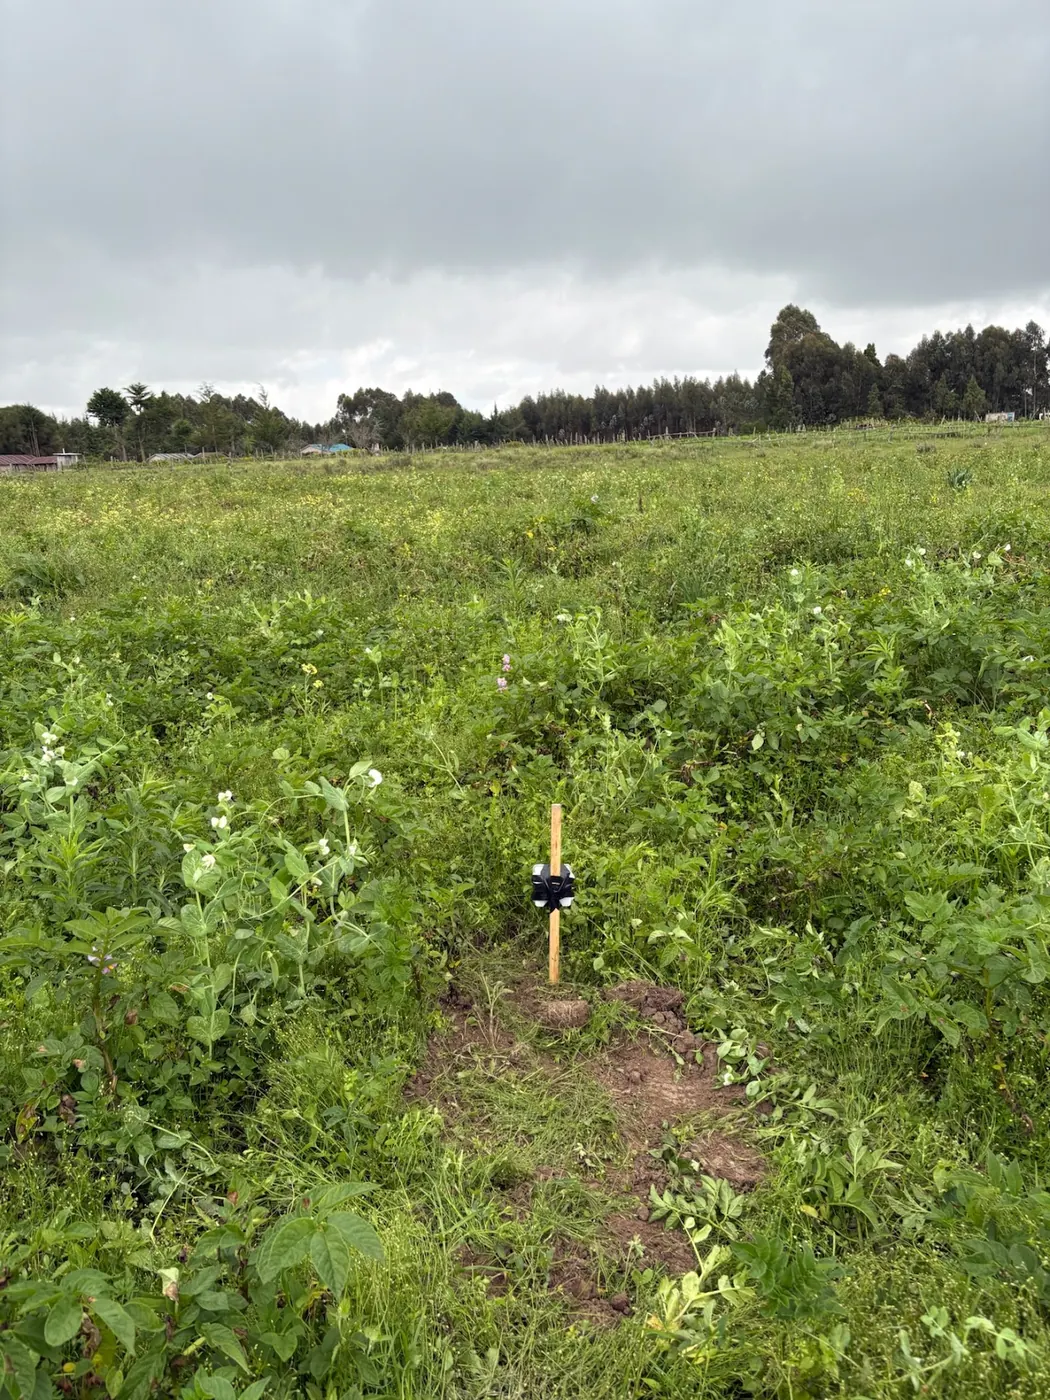
Our probes averaged 75 percent of sensor scale last month. That figure tracks wetting and drying honestly, but it is not a volume of water in the soil. Read your own field capacity 12 to 24 hours after heavy rain instead.
How deep the first rains wet the soil: probe readings
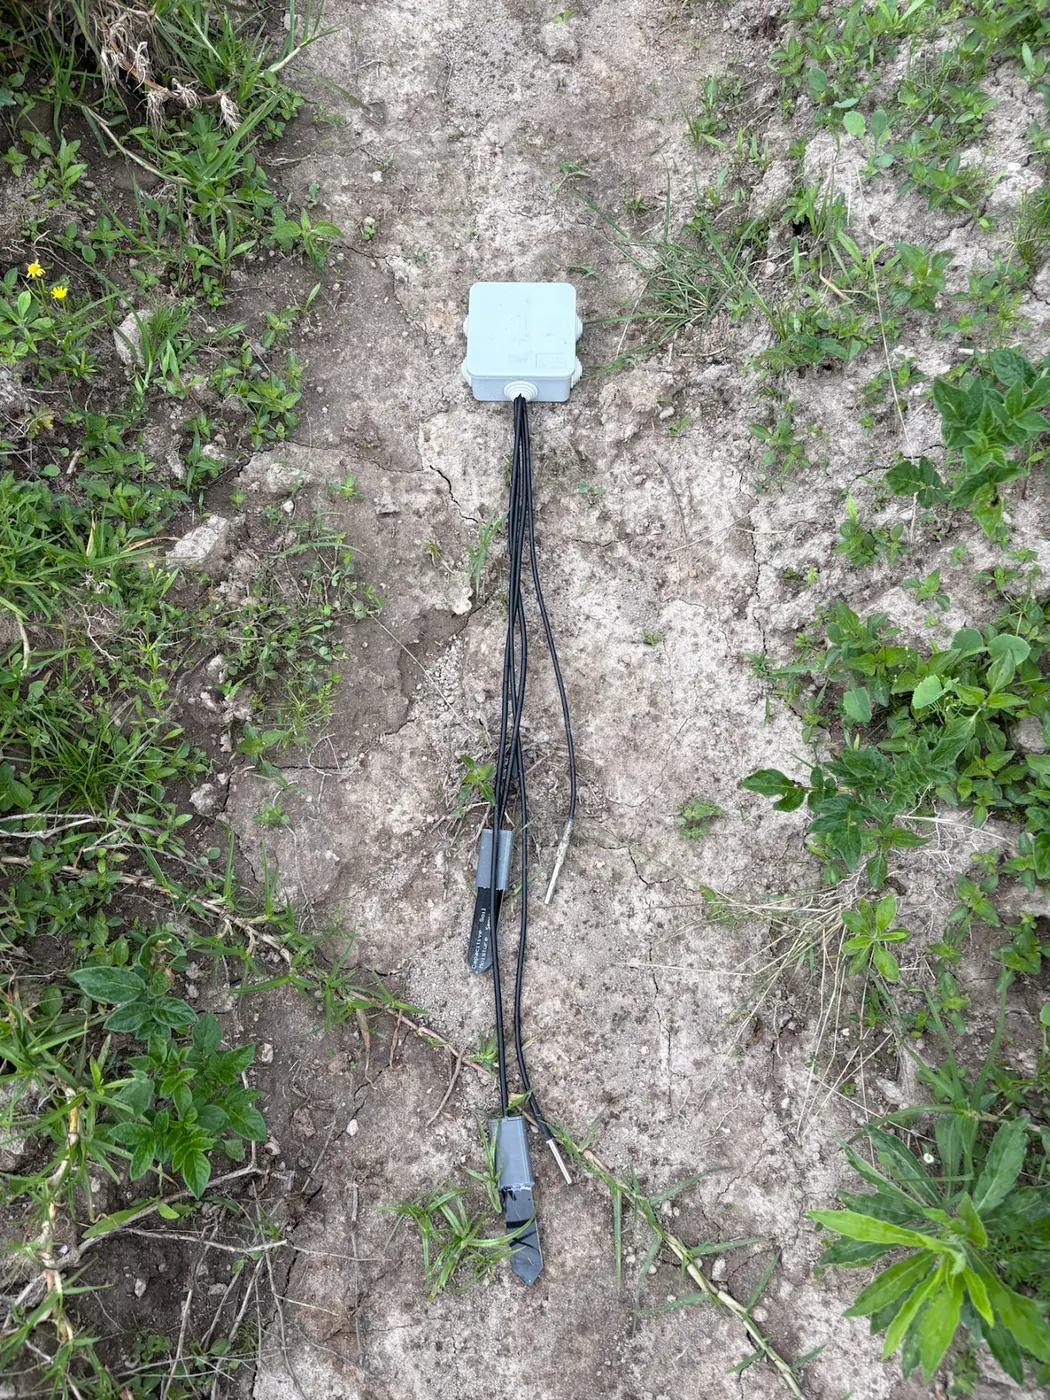
Water does not move down until the layer above it is full, so the shallow reading can jump while the deeper one sits flat for a day.
Should you replant maize now, or test the soil first?
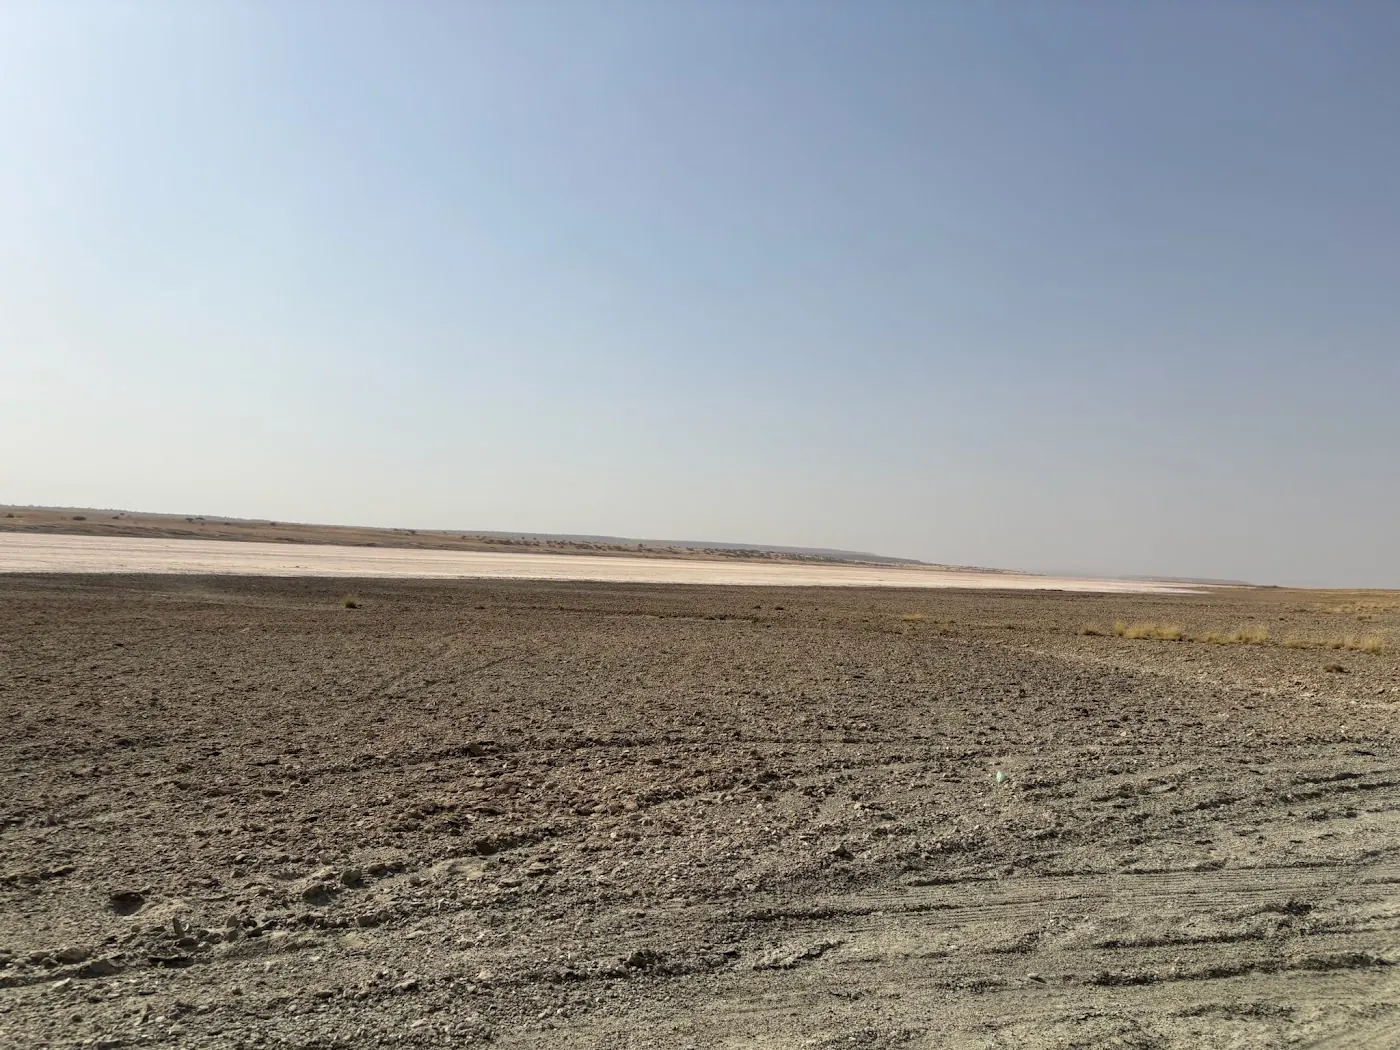
After the Daily Nation reported drought-hit farmers hesitating to replant, a four-county study of 1,592 maize growers found fewer than 8 percent had ever had their soil tested, and only 7 percent knew where to go for one.
What to measure in the drain water of a soil greenhouse
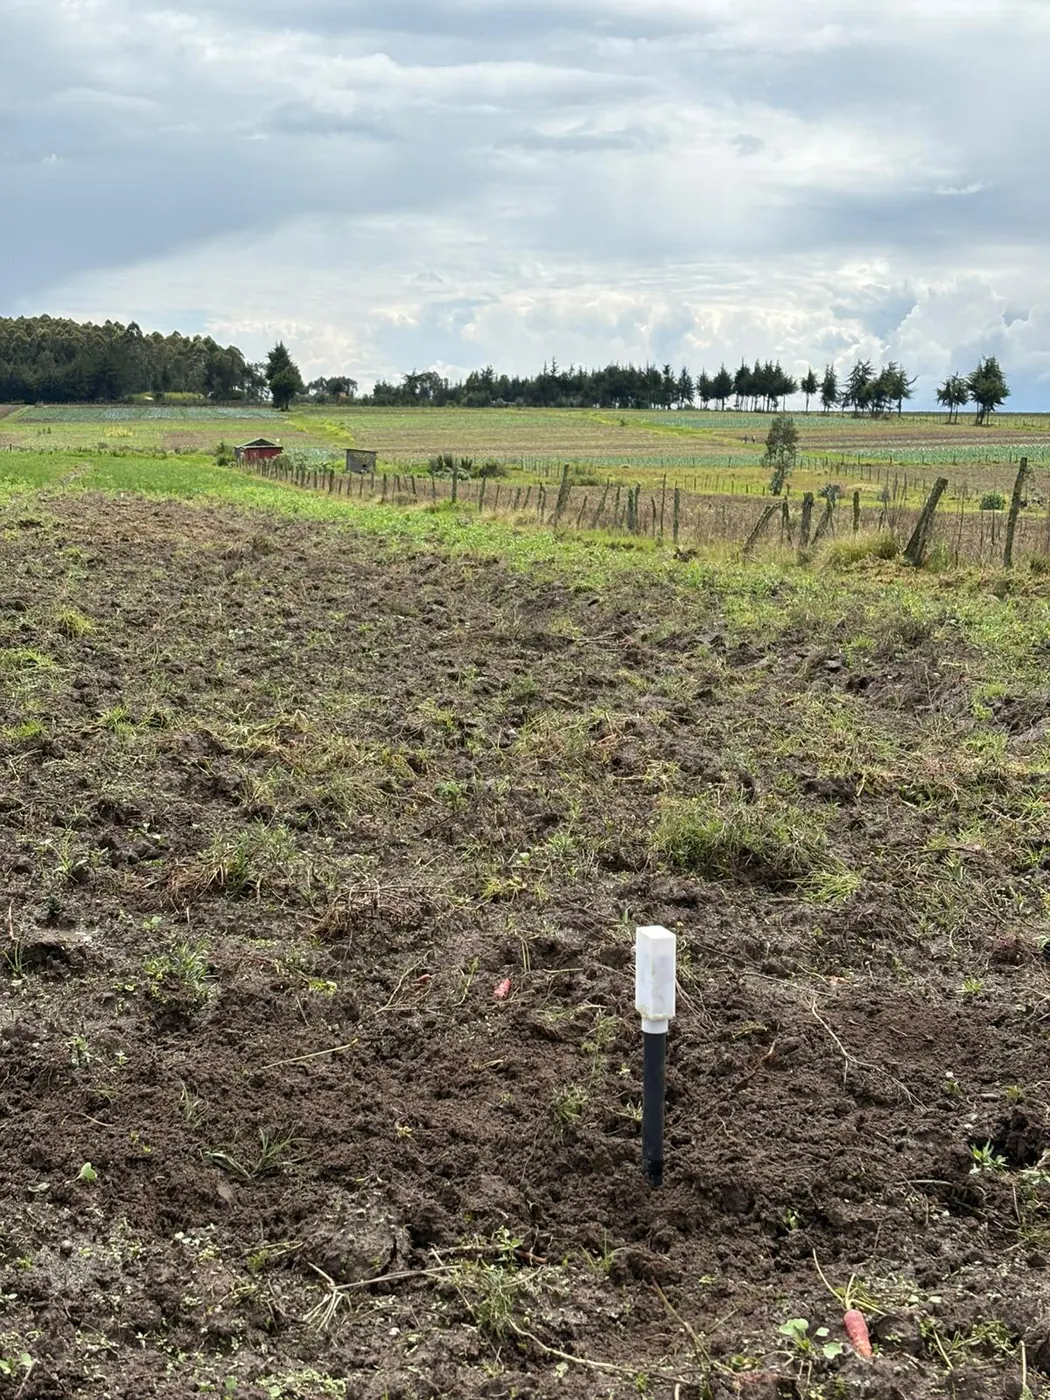
Water that reaches the drain has already passed the roots, so the timing of the flow says more than the volume. A bed that never drains has no route to flush out salt.