A reading of 75 on a soil probe looks like it should mean something absolute. It looks like 75 percent of the soil volume is water. It does not mean that. Treating a raw scale number as volumetric water content is the single most common misreading of a moisture sensor on a Kenyan farm. Our own network of soil probes averaged 75 percent of sensor scale across three stations over the past month, with most readings falling between 71 and 87 percent. That number is real. What it is a percentage of? Does it map onto the volumetric water content a research paper means by the same words? That is the part that gets skipped.
Measured by NuaSense weather stations and soil probes on Kenyan farms, over the period stated with each figure. Past readings, not a forecast.
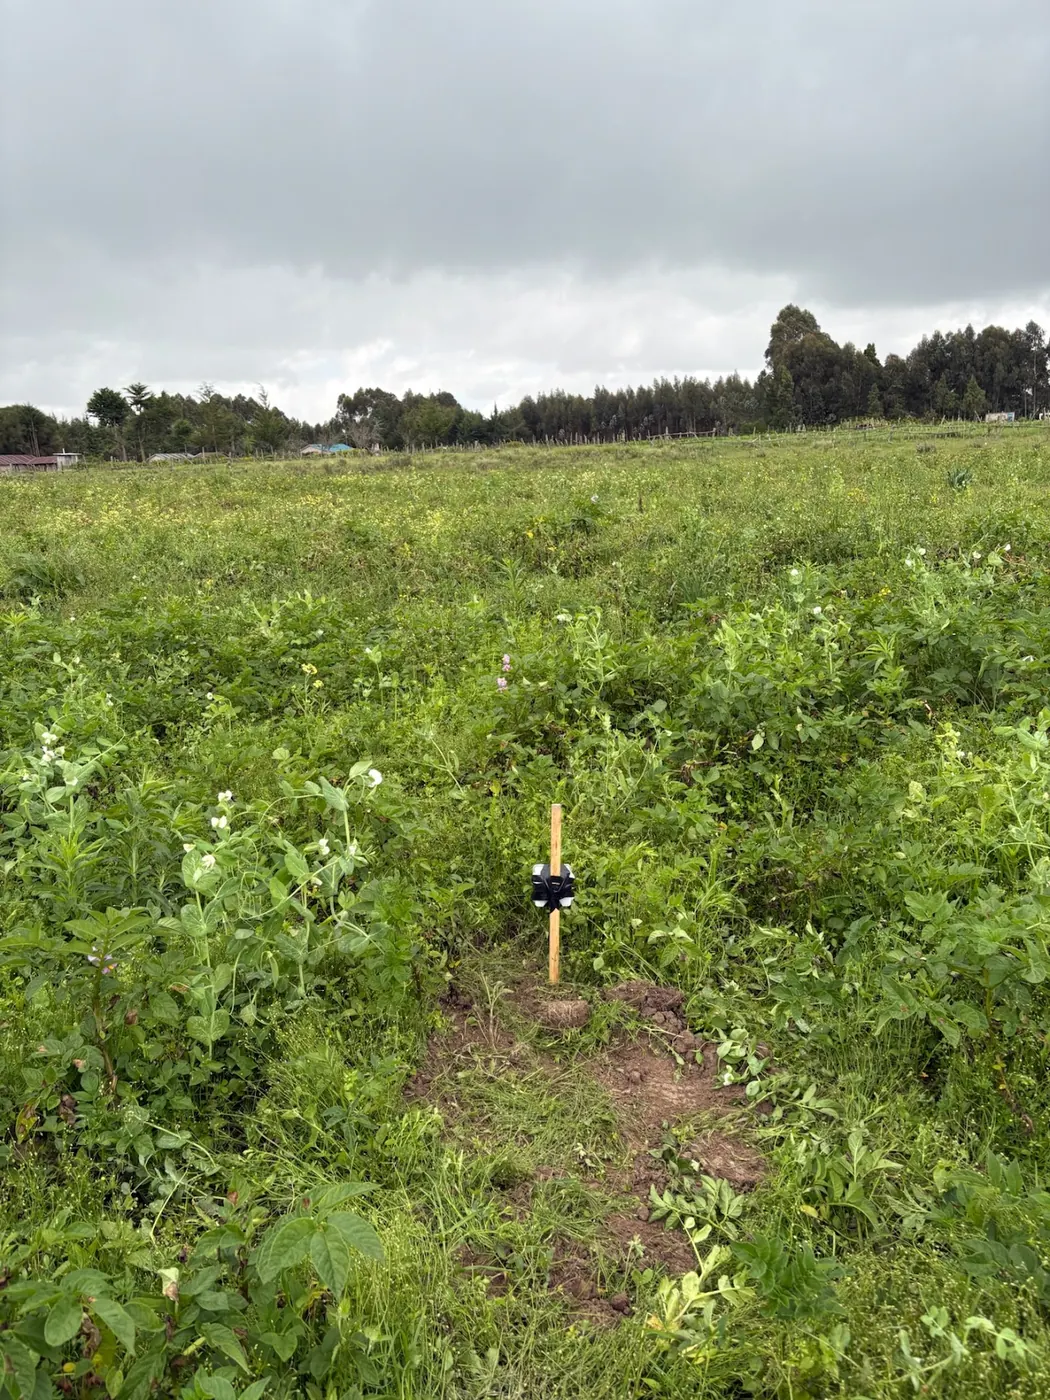
What the probe actually senses
Capacitive and other electromagnetic soil sensors do not measure water directly. They measure the soil's bulk permittivity, its dielectric constant, and infer moisture from that. The University of Minnesota Extension's guide to soil moisture sensors for irrigation scheduling is blunt about this: electromagnetic sensors measure volumetric water content only indirectly. Soil particles, water and air each have a different dielectric constant. The sensor is reading the mixture, not the water. Volumetric water content itself has a clean definition in that same guide: the volume of water per volume of soil, expressed as a percentage. So 25 percent VWC means a quarter inch of water in each inch of soil depth. That definition is a ratio of volumes. It is not the same thing as a raw sensor output calibrated to a proprietary 0 to 100 scale. It is not the same thing as a mass-per-volume figure either. That distinction trips people up the moment they start comparing papers.
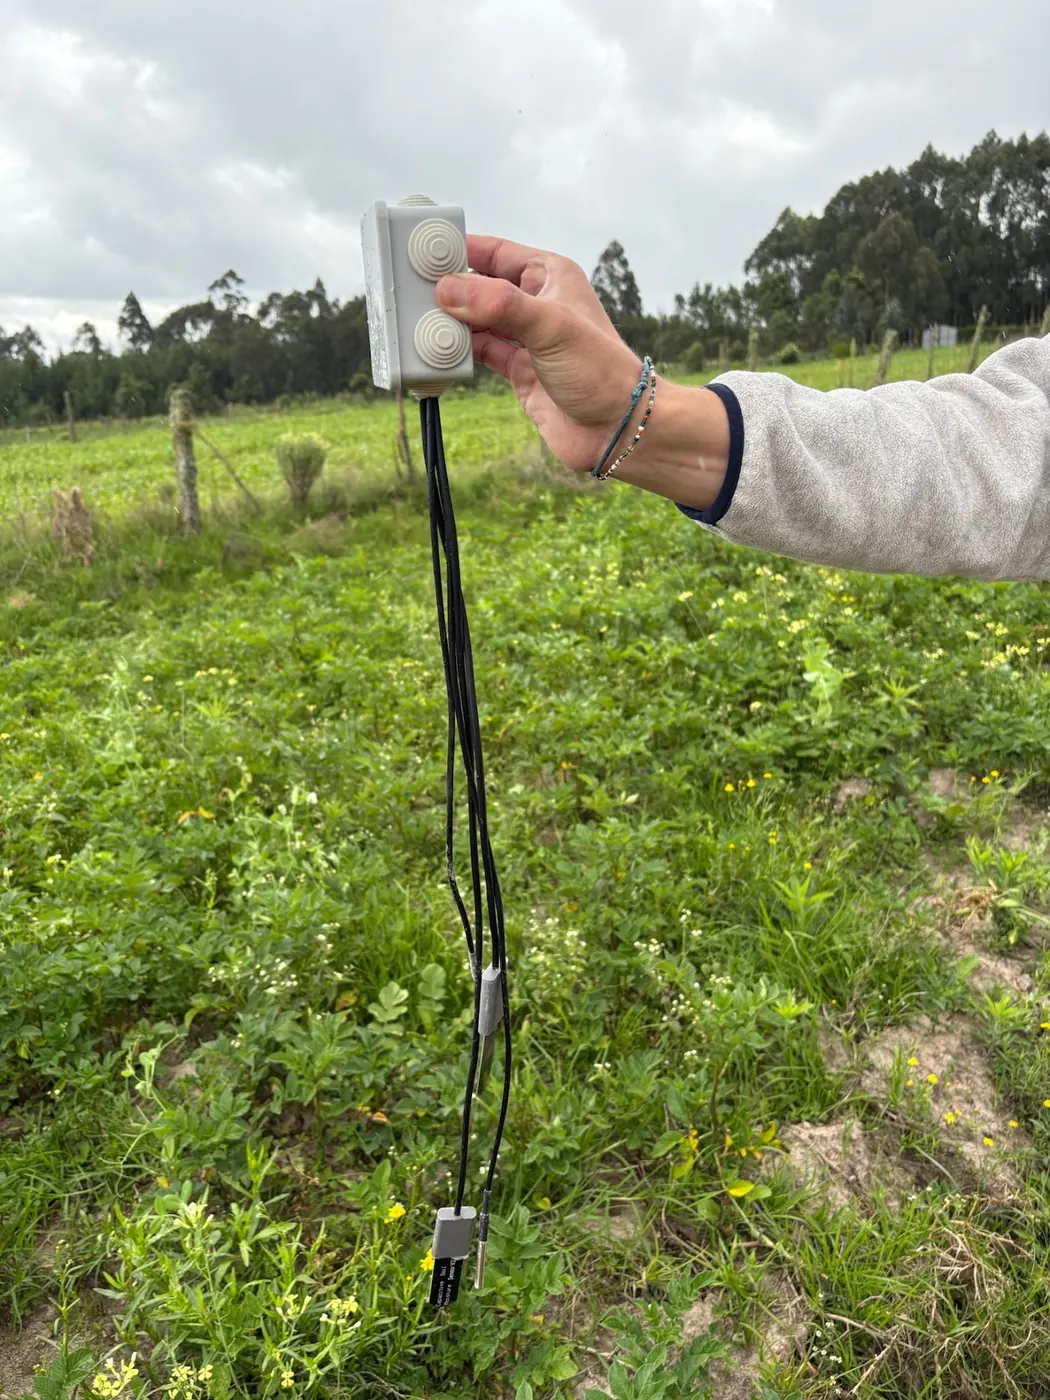
Our own LoRaWAN soil probes report percent of sensor scale, not calibrated volumetric water content. That is a design choice, not a shortcoming. A scale reading tells you whether moisture is rising or falling and by roughly how much. It does not pretend to a soil-specific number the instrument was never calibrated to deliver. Presenting that 75 percent figure as cubic metres per cubic metre would be wrong, full stop. No arithmetic in this piece will convert one into the other. The conversion depends on a calibration this sensor family does not carry.
Where the two numbers diverge
Two soils at the same volumetric water content can sit at very different points on a sensor's raw scale. The dielectric response depends on soil texture, bulk density and organic matter, not on water content alone. A German lysimeter study using an EnviroScan profile probe is described in a 2025 paper in Environmental Monitoring and Assessment covering uncertainties in the determination of water storage changes. It found that soil-specific calibration mattered most in layers with higher organic matter content. That is the layer where the raw dielectric signal and the true water volume drift furthest apart. A grower moving a probe from a sandy loam block to a heavier, organic-rich patch nearby should expect the same crop-available water to show up as a different number on the scale. Not because the water changed, but because the soil did.
This is also why the paper found something specific: when the readings held up and when they did not. Storage change estimated from the profile probe largely tracked the lysimeter's own reference measurement, except during intensive drying and rapid infiltration. Those are exactly the two moments an irrigation manager cares about most: the trigger point where the crop starts to stress, and the wetting event right after irrigation. The instrument is least trustworthy at the two ends of the cycle that matter most for a scheduling decision. That is not a flaw unique to this probe family. It is a property of how these sensors work. It holds whether the number on the display is percent of scale or a calibrated VWC.
Two units that get used as if they were one
A Kenyan example makes the confusion concrete without needing a foreign figure dressed up as local. A field study on zai pits with integrated nutrient management appears in the Kenyan repository record on zai pits combined with manure. It reports a volumetric water content of 1.55 g per cubic centimetre at 32 days after sowing. That is a mass-per-volume figure, grams of water per cubic centimetre of soil. It is not a percentage of soil volume as the Minnesota Extension guide defines VWC. The two are not directly interchangeable without knowing the density assumptions behind each. The source does not give you those. If you ever see 'volumetric water content' quoted in a study or a spec sheet, check the unit before you use the number for anything. Percent, g/cm3 and centibars of tension are three different physical quantities that all get called moisture readings in casual conversation.
Related reading on this site: soil moisture sensors, Soil moisture readings: the three numbers you need to read them.
The two sensor families measure different things entirely
Soil moisture instruments split into two families that are often talked about as if they were competing measures of the same thing. They are not. The Minnesota Extension guide separates them cleanly. There are sensors that estimate volumetric water content. And sensors that measure soil tension, the force with which the crop has to pull water out of the soil. A VWC-family sensor triggers irrigation once depletion reaches roughly 30 to 50 percent of available water holding capacity. That threshold is called management allowable depletion. It shifts with crop, growth stage and how fast the irrigation system can actually deliver water. A tension-family sensor on coarse-textured soil triggers at 25 to 45 centibars. That number does not apply to fine-textured soils at all. Converting a scale reading from one family into a trigger number built for the other family is a second, separate error. It is layered on top of the percent-versus-volume confusion. It happens constantly because both numbers get typed into the same spreadsheet column labelled 'moisture'. A tension reading and a volume reading answer different physical questions. Even when both are handed to the same irrigation manager on the same morning, neither one substitutes for the other just because both arrive in a spreadsheet column labelled moisture.
Field capacity is the one number you can read for free
There is a shortcut that avoids the conversion problem entirely, and it costs nothing beyond patience. The Minnesota guide points out that field capacity is the moisture a soil holds after gravity has drained the excess. It can be read directly from a sensor 12 to 24 hours after heavy irrigation or rain. Whatever the sensor shows at that point, on whatever scale it uses, is that soil's field capacity on that same scale. You never need to convert to a textbook percentage. You watch the number after the next good rain and write it down. Every subsequent reading gets compared to that soil's own baseline, not to a number borrowed from a different soil or a different sensor family. This is the practical answer to the whole percent-versus-VWC argument. Stop trying to translate the scale, and let the soil tell you where its own full and empty points sit.
What the worked depletion arithmetic actually needs
The Minnesota guide's worked example for centre-pivot corn on a Hubbard soil series shows what a converted number is actually for. With a 36-inch root depth, a management allowable depletion of 50 percent and crop water use of 0.20 inches a day, the total available water in that profile comes to 2.88 inches. The crop can deplete 1.44 inches before stress. At a current depletion of 0.96 inches there is 0.48 inches of buffer left. The daily water use figure turns that into roughly two days before the next irrigation is due. Every one of those numbers is inches of water, a volumetric quantity, not a raw sensor percentage. That arithmetic only works because the American VWC probes behind it were calibrated to report water depth per layer thickness. A Kenyan grower running our LoRaWAN sensors, reporting percent of scale rather than calibrated VWC, cannot plug a scale reading straight into that formula. It cannot expect an inches-of-water answer. The formula needs an input the scale reading was never built to give. That input requires a soil-specific calibration nobody has run for that field. That is not a defect in the scale reading. It is a mismatch between what the formula asks for and what the instrument was designed to report. No amount of careful arithmetic on the Kenyan side closes that gap without the missing calibration step.
Why calibration is the real cost, not the sensor price
The lysimeter paper is explicit that capacitive sensors often need soil-specific calibration. That calibration is time-consuming and labour-intensive. That single sentence explains why almost nobody in East Africa runs a properly calibrated VWC probe on a working farm. The equipment cost is rarely the barrier. The barrier is the fieldwork: taking soil cores at known moisture states, oven-drying them, weighing them. Then building a curve that relates the sensor's raw signal to actual water content for that specific soil. On a smallholder block with several soil types across a few hundred metres, that calibration effort multiplies. This is also why alternate wetting and drying and drip irrigation remain at what the Discover Water review of food security in East Africa calls micro-research levels across Uganda, Kenya, Tanzania and Ethiopia. Both are threshold-based practices that depend on a trustworthy moisture number. Adoption is limited by awareness, funding and technical knowledge. A threshold you cannot calibrate is a threshold you cannot trust. Growers know it even when they cannot name the reason.
What to buy, and what not to expect from it
A NuaSense soil sensor costs KES 7,000 for the base moisture and temperature version. It costs KES 9,000 for the version with two moisture and two temperature channels, or KES 10,000 for the version that also measures EC, though EC is not currently streaming from our deployed fleet. It reports at the shallow probe and the deeper probe roughly every ten minutes, over LoRaWAN through the weather station. The weather station costs KES 30,000 and also carries the connectivity, whether on Wi-Fi at no data cost or on a Safaricom SIM at roughly a dollar a month. What it gives a grower is a consistent, repeatable number that tracks up and down as the soil wets and dries. That is exactly what a management allowable depletion trigger needs, once you have set that trigger against your own soil's field capacity rather than a borrowed textbook figure. What it will not give you is a certified volumetric water content in cubic metres per cubic metre. If that specific figure is what an agronomic protocol, a research grant or an export certification scheme demands, this is not the instrument. A grower whose only need is that certified number should not buy one expecting it to satisfy that requirement. Our earlier piece on how deep the first rains wet the soil works through the same shallow-versus-deeper probe distinction from the other direction. It uses scale readings after rainfall rather than after irrigation.
The lowland and shallow water table complication
The lysimeter study notes that profile probes can be extended from a single point measurement to a larger area by installing several of them. That matters most where the root zone sits close to a fluctuating water table, a lowland condition common on land near rivers and wetlands. In that setting the water balance itself gets more complicated. Evapotranspiration, seepage and outflow draw storage down while rain, inflow and irrigation top it back up. A rising water table can lift the moisture reading from below just as convincingly as rain lifts it from above. A grower on a lowland block reading a rising scale value has to ask which direction the water came from before treating it as evidence that the last irrigation worked. This is not a conversion problem. It is a plumbing problem, and no unit fix solves it. The instrument cannot tell the difference between water arriving from the surface and water arriving from underneath. Only the grower's own knowledge of the site, and a check on nearby drainage or a rising water table, can settle that question.
Reading the number without pretending it is something else
None of this means the scale reading is useless. It means only that it is honest about what it is: a repeatable, soil-and-instrument-specific signal, not a portable volumetric truth. The practical discipline the Minnesota guide recommends, checking sensors every two to three days and logging them, works exactly as well on percent-of-scale data as on calibrated VWC data. The trend, not the absolute figure, is doing the work. A wider look at how smart irrigation technologies are being used across Kenya makes the same point from the equipment side: the sensor is one part of a decision. And the decision still depends on the grower knowing what unit is on the screen in front of them. Read the trend against your own field capacity, not against a number out of a paper measured on a different soil, in a different country, on a different scale, and the probe becomes a tool again instead of a source of false precision.