Salinity in irrigation water is an accounting problem first, a chemistry problem second. Each watering adds dissolved salt to the block. The water leaves through evaporation and crop use, but the salt stays. The USDA salinity research unit puts it plainly: irrigation inevitably leads to salinization of soils and waters, because evaporation and transpiration make salts accumulate unless leaching and drainage are adequate.
So the title question comes down to comparing two flows. Salt in, from the pump or the river intake. Salt out, through drainage beneath the roots. Water that tests well can still ruin a block that never drains. Water that tests badly can be run for years on a block that flushes properly.
A caveat on the evidence. Almost everything below was measured in the United States, in China, or in FAO guidance written for the whole world. There is no Kenyan table here, and no Kenyan authority limit appears. You have to check how it transfers to your soil and your pump, and the text says where that gap bites.
Measured by NuaSense weather stations and soil probes on Kenyan farms, over the period stated with each figure. Past readings, not a forecast.
Start with the water, not the soil
According to the Colorado State Extension guide to irrigation water quality criteria, the salinity hazard, measured as the electrical conductivity of the water (ECw), is the most influential water quality guideline for crop productivity. Get that number first. Let the pump run long enough to clear standing water, then fill a clean bottle at the borehole outlet and send it to a lab for EC, sodium, calcium, magnesium and bicarbonate.
Why test all five? EC tells you how much dissolved salt is there. The others tell you what kind. Sodium against calcium and magnesium decides whether the salt damages soil structure. That harm is separate from the osmotic stress EC describes. A handheld EC meter is a fair screen, but it is not a water analysis.
Also sample the river, and do it more than once. A borehole tends to stay steady. A river intake does not, and the figure that matters is the worst one you will irrigate with, not the average. The sources give no Kenyan seasonal pattern for river salinity, so none is offered here. Take samples across your own dry and wet periods, and write the date and pumping hours on each lab sheet.
Turning an EC figure into tonnes of salt
The Utah State University guidance on saline and sodic soils gives two benchmarks. Water with an ECw of 2 dS/m carries about 1.7 tons of salt per acre-foot. Put on 30 inches of it in a year and you add about 4.4 tons of salt per acre. Colorado State adds that water at only 1.15 dS/m holds approximately 2,000 pounds of salt per acre-foot.
Check the Utah sum. Thirty inches is 2.5 feet, and 2.5 acre-feet at 1.7 tons each comes to 4.25 tons, close to the quoted 4.4. That small gap is the source's own rounding, so use the quoted figure. These are US units. Convert carefully if your records are in hectares and cubic metres.
Scale is what this sum is about. Water that looks mildly saline on a lab sheet still delivers tons of salt per acre over a season, and that salt does not leave by itself. Multiply your seasonal water volume by the dissolved salt in your own sample, and you get the annual salt import for the block. Ask the lab to report total dissolved salts in mg/L next to EC, so you can do the multiplication from your own volumes. The sources offer no Kenyan conversion from dS/m to kilograms per hectare.
The ratio that matters: leaching fraction against requirement
The FAO guidance on safe use of saline water defines a leaching requirement (Lr). Over the long term, it is the minimum net amount of water that must pass through the root zone to prevent excessive salt accumulation. That changes the question from a threshold into a ratio. Is the fraction of applied water that actually drains below the roots larger or smaller than the requirement for this water and this crop?
That is why the word salty means little on its own. A moderately saline water on a free-draining block with a generous leaching fraction can be fine for years. A mildly saline water on a block where every drop is metered to the crop's need, with nothing passing below the roots, is quietly building a deposit. The measure of whether you are winning is the balance, not the lab sheet.
The FAO text adds a detail that shapes sampling. In fields irrigated to steady state, soil water salinity is essentially uniform near the surface whatever the leaching fraction, but it rises with depth as the leaching fraction falls. A surface sample can therefore look fine while the lower root zone concentrates salt. Drainage matters as well: FAO says it must keep the water table deep enough to stop salt-laden groundwater rising into the root zone by capillary forces.
On a Kenyan block, this means judging the field by neither its top few centimetres nor the water test alone. You need to know how much water drains past the roots, which depends on soil texture, irrigation depth and drainage. The earlier post on measuring soil infiltration rate before setting run times covers the first half, since a run time longer than the soil can take in produces runoff, not leaching.
The FAO excerpt gives Lr as a concept. It does not give a Kenyan crop-by-crop value, so take the figure for your crop and your water from the FAO tables themselves.
Does the rain wash it out?
Sometimes. A North Carolina State Extension study of sodium salts in coastal fields found that maximum sodium accumulation occurs when soils are relatively dry before saltwater arrives, because more sodium contacts soil particles directly. Significant post-storm rainfall, by contrast, dilutes and flushes salt from soils. Both halves matter. Flushing needed significant rain, and the soil state before the salt arrived changed the outcome.
That work covered coastal fields hit by storm-surge seawater. The 4 to 16 parts per thousand in Hyde County drainage canals, against 32 to 36 for seawater, belong to that setting, and they do not describe an inland Kenyan borehole. What transfers is the principle: rain is a flush only if enough falls, and dry soil holds incoming salt more firmly.
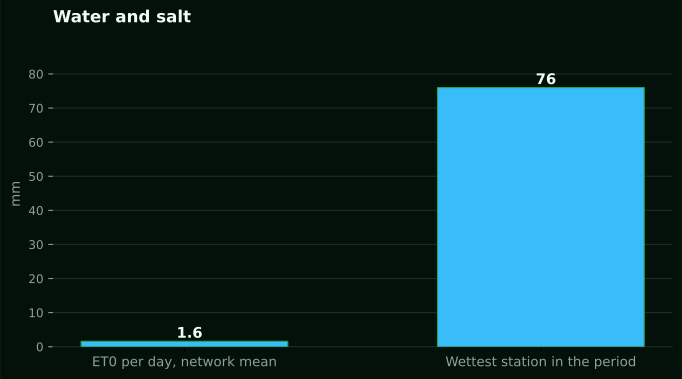
Rain can be thin, and our own network shows it. At 7 stations from 11 September to 11 October 2026, only 184 of 10,979 ten-minute readings recorded any rain. That works out to 1.7 percent. Station totals for the period ran from 0.4 mm to 76.4 mm across 4 stations. Those stations are not co-located, so this is a spread, not a regional figure.
In the grid cells where our stations stand, long-term October rainfall averaged 61 mm over 43 years of CHIRPS data (1983 to 2025). The driest October came in 1996 at 20 mm; the wettest was 290 mm in 2019. CHIRPS is a satellite-and-gauge product, not one of our gauges. With that much spread, no one month can be counted on to flush a block.
Why a clean-looking water can still seal the soil
Salinity and sodicity are different harms. Sodicity is about sodium relative to calcium and magnesium, expressed as the sodium adsorption ratio (SAR). Utah treats soils with SAR above 13 as sodic. For Colorado, the soils most likely to show reduced infiltration and crusting from water with SAR above 6 are those with more than 30 percent expansive smectite clay.
The awkward part is that low-EC water can be the dangerous one. The Colorado and Montana material notes that at the same sodium content, low-ECw water has greater swelling potential, so SAR damage is more likely when salinity is low. A borehole that tests pleasantly low in EC may seal the surface of a clay soil where a saltier water would not. Read the two tests together.
To compute SAR from a sheet in mg/L, the Colorado guide gives the conversion to meq/L. Divide sodium by 22.9, calcium by 20 and magnesium by 12.15. Where bicarbonate goes above 200 mg/L or pH goes above 8.5, an adjusted SAR should be calculated. Many labs report SAR for you, so ask which version they used.
The Montana State guidance on irrigation water suitability adds that SAR over 9 can cause direct toxicity or interfere with calcium and potassium uptake, and that sodium can be directly toxic to woody plants from around 70 mg/L, with more risk under sprinklers because of leaf burn. It is written for residential plantings, so treat it as a warning, not a commercial crop limit.
Where your irrigation method puts the salt
The method changes where salt ends up as well as how much arrives. Utah says salt gathers on crop bed edges, furrow edges and in surface cracks, because it moves with water. With drip, salt is forced down and out from the emitter and can build at the surface above the roots, which is especially hard on plants placed midway between emitters.
Drip, then, is not a leaching method. FAO does say that forms of irrigation minimising matric stress, such as drip, can reduce the harm of irrigating with saline water, because the soil stays wetter near the roots. Less stress is not removal. A drip block still needs a deliberate leaching event.
FAO puts sprinklers ahead on salt removal. Per unit of leachate, they take out more salt than flood does. The separate catch is foliar burn from sodium and chloride. So sprinklers are not worse for the soil here, but they can still hurt the crop above it.
If a greenhouse runs on drip off a saline borehole, don't take your sample at a random spot. Sample at the wetted edge and under the emitter. The sources give no Kenyan emitter spacing, so map the wetted pattern on your own block first.
Sampling the soil at the right depths
A water test shows what comes in. A soil sample shows what stays. NC State's protocol takes samples at 0 to 2, 2 to 4, 4 to 8 and 8 to 12 inches, or at the very least cuts a 12-inch core into upper and lower 6 inches. That follows from the FAO depth gradient: skim only the surface and you miss it.
The same study found that the sodium figure on a routine soil report can point to soluble salt level. Across 910 data points, soil test sodium predicted the soluble salts index with an R-squared of 0.9798. That fit came from North Carolina soils, so it is not a Kenyan conversion. Seedlings may show salt damage at a soluble salts index of about 50, depending on crop, stage, soil and moisture. Once exchangeable sodium percentage reaches 15 or more, sodium can damage soil structure, clays most of all.
Go back to the same spots each year, at the same depths and the same point in the irrigation cycle. If a deep reading climbs over several seasons, leaching is falling short of requirement, even when yields still look acceptable. EC is offered as a NuaSense product but is not currently streaming from our deployed soil fleet, so no live EC trend is quoted here. Ask about the EC sensor variant, and keep a lab sample as the check.
Test, blend, leach or switch: the options side by side
What you are deciding is which of four moves to make. The costs below are described in kind, because the sources carry no Kenyan prices for drilling, blending tanks or lab fees.
- Test (water and soil, each season). Cheapest, and the precondition for everything else. It buys ECw, SAR and a depth profile. It prevents expensive mistakes but removes no salt.
- Blend (mix saline water with a better source). Costs storage, extra pumping and access to a second water. It lowers ECw before the water reaches the crop, but only works if the second source holds up in the dry months, when you most need it.
- Leach (apply extra water to push salt below the roots). Costs water and pumping energy, and needs drainage that keeps the water table deep. Without drainage, leaching only moves the problem. On a block with high-SAR water, extra water can pond instead of drain.
- Switch source (river for borehole, or the reverse, or stored runoff). The largest capital question. It is a permanent fix only if the new water is clean in every season, which only repeated tests will show.
The order matters. Testing always comes first, and it often shows leaching is enough. Blending is the next step up, because you can undo it. Switching cannot be reversed in any practical sense, so it should rest on several seasons of lab sheets, not one bad result.
One caution on blending. Mix a low-EC water into a high-SAR one and the SAR problem is not repaired, only the salt diluted. If infiltration is the complaint, the lab sheet needs to show the sodium, calcium and magnesium of the blend, not just its EC.
The position: test twice a year, leach on purpose, blend before switching
Testing won't cost you much, and the leaching requirement is just a ratio you can handle with extra irrigation, provided the drainage is there. So work it in this order: test, leach on purpose, blend if the figures still come up short, and change your source only as a last resort.
On clay, high SAR and low EC in your water flip the order. There the trouble is infiltration, and the extra leaching water may run off or sit in a pond. Deal with the water chemistry first, and take advice from an agronomist who has seen your lab sheet, because these sources give no Kenyan treatment protocol.
Treat rain as a bonus, never as a plan. In the CHIRPS series our October record swings between 20 mm and 290 mm, and the North Carolina work shows flushing depends on significant rainfall. Count what your own gauge records. And if soil sampling shows salt rising at depth, schedule a leaching irrigation after the dry months.
A soil moisture probe helps with that step, though it does not measure salt. Our soil moisture sensors report relative moisture as percent of sensor scale, not volumetric water content. The deeper probe shows whether a leaching irrigation reached the lower root zone. Pair it with a lab sample afterwards. To size the extra water, the arithmetic is set out in turning evapotranspiration into an irrigation depth in mm.
What to log, and why the stakes are high
Four records give you a rough annual salt balance: the dissolved-salt figure for each water source, the volume applied, the rainfall, and the soil profile at fixed depths. The first two are the salt going in. The last two tell you whether salt is leaving. NuaSense's overview of smart irrigation in Kenya covers drip systems, moisture sensors and solar pumping, the background you need for deciding how much extra water a block can afford.
Our station records rainfall in millimetres from a tipping-bucket gauge calibrated per installation, and it computes hourly reference ET0. Across 7 stations from 11 September to 11 October 2026 that averaged 1.6 mm per day. That is reference ET0, not crop use, for a past period. A station costs KES 30,000 and a soil sensor KES 7,000, excluding taxes, with an EC version at KES 10,000. Buying any of it to answer the salt question alone makes no sense. The lab sample is the answer.
The stakes reach beyond any single farm. The USDA unit reports that irrigated land is 15 percent of the world's cultivated land but yields 35 to 40 percent of the harvest, and that salinity limits production on about 50 percent of irrigated area. A Discover Water review of East African irrigation found 79 African schemes that consistently underperform. Salt is not named as the cause there, but little margin is left for a hidden loss.
A red-soil study reported on AGRIS was irrigated with 1, 2, 3, 5 and 10 g/L NaCl and found soluble salt, sodium and chloride rising in straight-line proportion to water salinity. The soil also adsorbed chloride, so on red soils do not assume the leachate carries everything away.