One soil moisture number on its own won't tell you much. Seventy-eight percent of sensor scale might be a crop drowning in a clay pan, or a crop getting through a dry week just fine in sandy loam. The second reading beside it is what turns that number into a decision: where the probe sat at the last irrigation, where it sat after the crop wilted, where it sat the week the pods filled out. That comparison is the method this piece is built on. It is also the only honest way to set a soil moisture range, since the sensor scale does not compare across soils, and no printed table can sort that out for you.
Measured by NuaSense weather stations and soil probes on Kenyan farms, over the period stated with each figure. Past readings, not a forecast.
What the number on the screen is actually measuring
Capacitance and TDR probes are the two families covered in the Oregon State University guide to soil moisture monitoring. They report a dielectric signal linked to water content, not a direct count of water molecules. Some give volumetric water content in cubic centimetres of water per cubic centimetre of soil; others give a percent of an internal scale calibrated at the factory. These units are not the same. Swap one for the other without converting, and a good reading can turn into a bad decision. A previous piece on this site, the difference between percent of scale and volumetric water content, lays out where the two split and why a raw percentage from a capacitance probe should never be treated as a volumetric figure without that calibration step.
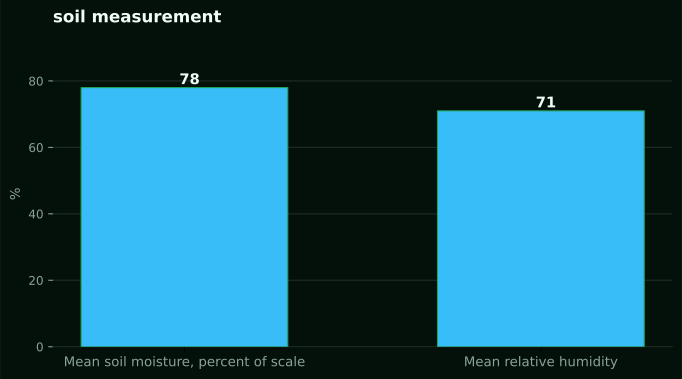
NuaSense soil probes report relative moisture as a percent of sensor scale. In our own deployed network, readings averaged 78 percent of scale in the four weeks to 27 September 2026. Most of them landed between 72 and 87 percent. That spread is real and measured, from two probes in the ground. It also tells you something useful about how tight a range can look across a month with almost no rain. In that same period, only 1.6 percent of ten-minute readings across the wider weather network recorded any rain at all. But it tells you nothing about whether 78 percent is wet or dry for a specific crop. The number only means something against the same probe's own history in the same soil.
A Nigerian field study shows how much land use alone moves the number
A field-scale study at the Obafemi Awolowo University farm in Osun state, Southwestern Nigeria, shows plainly why a shared number is dangerous. The study of soil moisture variability across land uses measured soil moisture from 0 to 47.9 percent on arable farms, 0 to 49.9 percent on cocoa land, 0.2 to 49.7 percent on oil palm, and 5.6 to 94.1 percent on riparian vegetation beside the river. Same instrument, same farm, and the same rainy season from April to October. The riparian strip alone spans a wider range than all four other land uses put together.
Those figures are not Kenyan crop targets, and the study never claims they are. What it shows is a mechanism: land cover and where a field sits in the landscape change soil moisture regardless of what is planted. A block beside a seasonal watercourse in Kenya will act differently from a block on a ridge fifty metres away, even with the same crop and the same rain event. That is why you should not copy any published table wholesale, whether it comes from Nigeria, an extension leaflet, or a neighbouring farm's probe. The land is a variable, not a constant. Your probe is the only instrument standing on your particular patch of it.
Field capacity and wilting point are the two marks that actually bound the scale
Every soil has two physical points that matter, no matter what unit the probe reports in. Field capacity is what is left after gravity has pulled the excess down through large pores. Depending on texture, that sits at roughly minus 10 to minus 33 kPa of tension, according to the Oregon State University guide cited above. Permanent wilting point is the drier end. At that point a plant can no longer pull water from the soil fast enough to recover once it wilts. The space between the two is available water capacity, the water a crop can draw on between one irrigation and the next.
You cannot look up either point as a percentage for your farm. Both depend on texture. A sandy soil holds a narrower available water capacity than a clay soil, even though clay often shows a higher raw moisture number at the same tension. That is why a probe reading of 60 in a sandy block and a reading of 60 in a heavy clay block are not directionally comparable events. The practical fix is to find your own field capacity. Read the probe the day after a thorough irrigation or a heavy rain, once drainage has stopped and the reading has settled. That settled number becomes your working field capacity mark on your own sensor scale, in your own soil, for that installation.
Feel and appearance, the check that costs nothing
Before you trust a probe blindly, know what a trained hand can already tell you. The Oregon State guide reports that the feel-and-appearance method, squeezing a handful of soil from the effective rooting depth and judging texture and cohesion, estimates volumetric water content within roughly 5 to 10 percent, depending on the operator and the soil. Sandy soil feels loose and will not hold a shape even when moist. Loam makes a weak ball. Clay feels sticky and ribbons between your fingers when squeezed.
Two things make this matter. First, it gives you a free way to cross-check a new probe: if your hand tells you the topsoil is clearly dry, but the shallow probe has hardly moved since yesterday, one of them is wrong. Dig in and find out which. Second, it sets a realistic bar for what precision buys you. A probe that only ever lines up with a trained hand within 5 to 10 percent is mostly confirming what a careful scout already knew. The case for a probe is not that it replaces the hand-feel check. It is that it keeps reading at ten-minute intervals through the night and through the week you cannot walk the block. And it lets you compare today with a specific day three weeks ago, not with memory.
Ground-truthing a reading against something independent
That same Nigerian study put its ground sensor readings beside a satellite soil moisture product. It found the satellite overestimated the minimum values by 66 percent and underestimated the maximum values by 4 percent. One comparative analysis, from one study, in one place, is not a universal correction factor for every satellite product or every probe. But it does establish a habit worth adopting: any remote or indirect estimate of soil moisture needs a ground check before you trust it. And the direction of the error is not always what you would guess. You could argue an overestimate at the dry end is the more dangerous of the two, because it tells a manager the crop has more water in reserve than it actually does.
If a probe is already sitting in your soil, the same Oregon State guide describes the ground-truth equivalent: the gravimetric method. Oven-dry a soil sample at 105 degrees Celsius, then weigh the water lost against the dry mass. It is slow and destructive, not a weekly job. But do it once against a new probe installation, at a known wet point and a known dry point. That gives you two fixed reference marks on your own sensor scale, something a factory calibration curve cannot promise. Skip this step and you have the single biggest reason a farm ends up with a probe reading nobody trusts by the second season.
This follows on from Soil moisture readings: the three numbers you need to read them, which covers Soil moisture readings: the three numbers you need to read them.
Related reading on this site: soil moisture sensors, soil temperature sensors.
Building your own upper and lower mark, with the record you already have
After one full irrigation cycle with a probe in the ground, you have what you need to build your own range. The arithmetic is simple. Take the settled reading the day after a full irrigation or heavy rain. That is your upper mark, your working field capacity on that sensor's scale. Then watch the reading through the dry stretch that follows. Note the level where the crop first shows visible stress: wilted leaves at midday that do not recover by evening, or a visible check in growth on a crop you can see week to week. On the same probe and the same soil, that level is your working lower mark. The gap between the two is your operating range for that crop, that stage, and that specific installation. It is worth more than any published figure because it came from your own field.
You need to repeat this at every growth stage. Rooting depth and transpiration demand both change through the season. The Oregon State guide says it directly: crop type and growth stage change how fast a crop pulls water from the same soil. A young transplant with a shallow root system hits a stress point sooner than the same crop in full canopy, where roots run past the shallow probe into the deeper one. In our own network's four-week record, the deeper probe moved through a smaller temperature and moisture range than the shallow one over the same period. That is what you would expect if it sits below where the surface dries and rewets fastest. Track both depths separately instead of averaging them. The average hides the depth the crop is actually pulling water from at that stage.
Why fertility can look like a moisture problem and is not one
Even a range you build correctly can mislead you if the crop's constraint is not moisture at all. Research on semi-arid eastern Kenya, summarised in a study of soil moisture conservation and cropping systems, found low soil fertility tied to very low crop yields even in years when rainfall was not limiting. So if your probe reading sits comfortably inside your working range and the crop still performs poorly, check nutrients before you assume the moisture threshold itself is set wrong. The CGIAR's overview of water and soil nutrient management under smallholder rainfed systems is another reminder: it treats water and nutrients as a joint constraint across Ethiopia, Kenya and Tanzania, not two separate problems solved by two separate instruments. A moisture probe answers a moisture question. It was never built to answer a fertility one. Stretch it to do that and you get a lot of good sensor data blamed for the wrong failure.
Here is where soil texture needs a caveat. It is pulled from a modelled baseline, not measured in that field. A baseline soil map, whatever its source, gives you a starting guess at texture and water holding capacity for a location. That is useful for a first estimate before the probe has any history. But it is a map value from roughly 2016, not a test of the specific field the probe stands in. The guide to crop yields in Kenya covers the wider set of soil fixes that sit alongside moisture management. Read it before you assume a probe alone will explain a yield gap.
Three ways to set the range, laid out against each other
No one method is the right one. What you pick mostly depends on how much history you already have and how much time you want to put in upfront.
- A published or borrowed table: costs nothing, available immediately, but the ranges in it were measured on a different soil under a different sensor's scale, so applying it here is a guess dressed up as a number.
- Feel-and-appearance scouting alone: costs only time, accurate to roughly 5 to 10 percent by the Oregon State estimate, but gives no record between visits and misses what happens overnight or while you are away.
- A probe with your own settled-reading record: needs one full irrigation cycle and one dry stretch before it produces a usable range, and a gravimetric ground-truth sample is worth doing once, but after that it reads the actual soil under the actual crop, at ten-minute intervals, without you standing in the field.
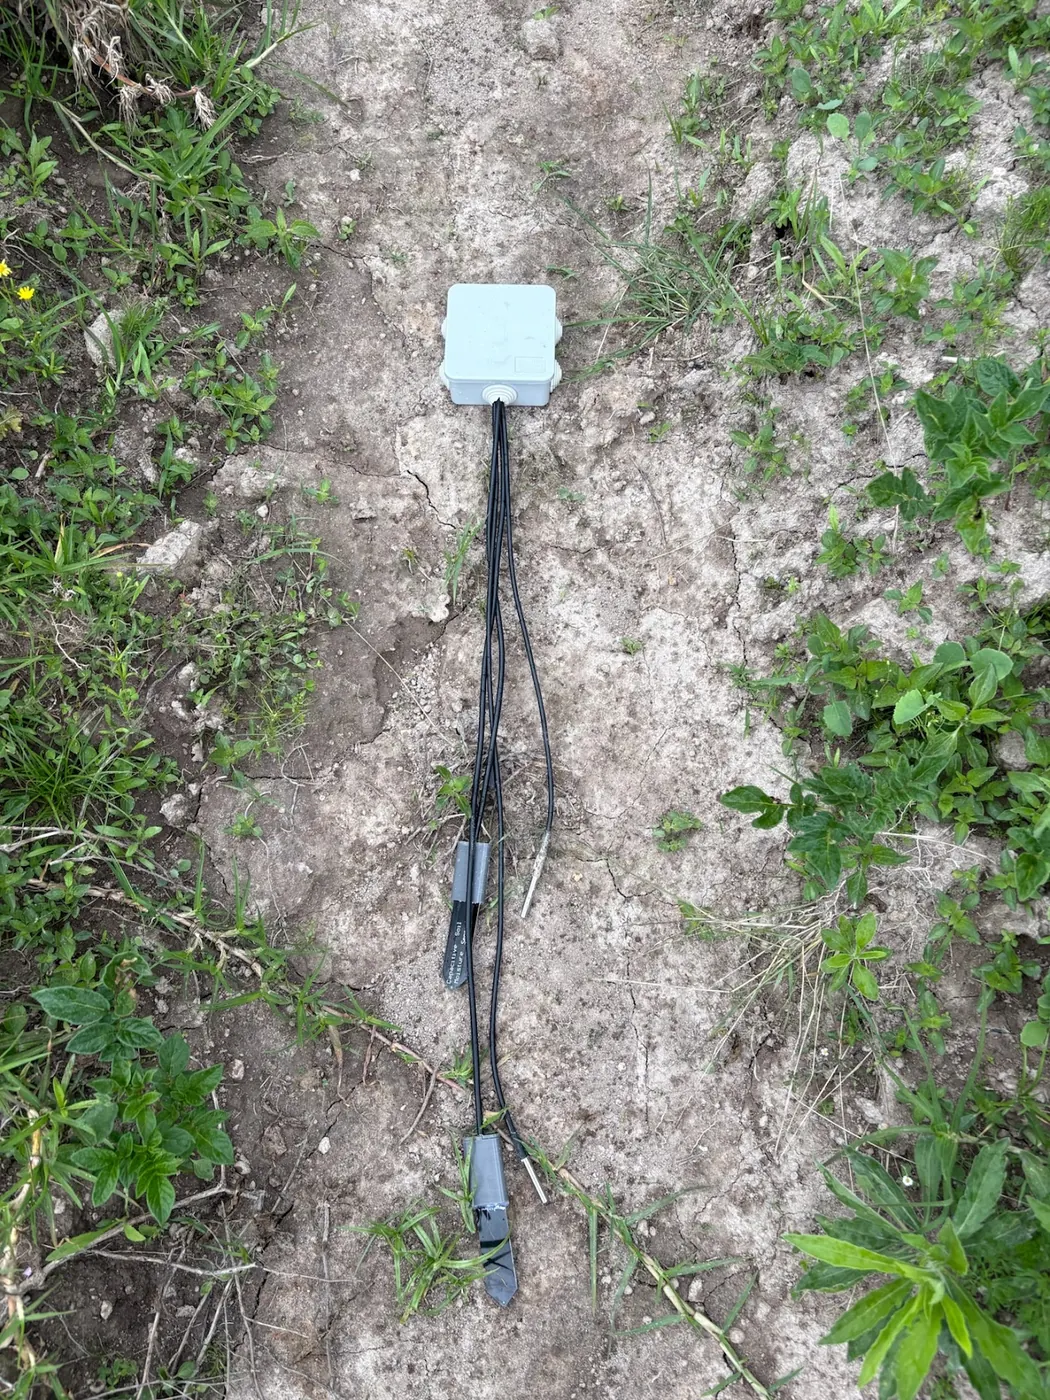
A NuaSense soil sensor will set you back KES 7,000 for the base moisture and temperature channels. The two-moisture, two-temperature variant costs KES 9,000, and the version that also measures EC costs KES 10,000. That said, EC is not yet streaming from the deployed fleet. Those prices do not get you a ready-made range. They get you the record you need to build one, at both depths, so you are not guessing which depth the crop is actually pulling from this week.
What our own network's spread suggests, and its limit
For our own soil moisture record, two probes contributed over the four weeks to 27 September 2026. The middle 80 percent of readings fell between 72 and 87 percent of sensor scale. That is a 15-point spread on the scale, during a stretch when the wider weather network recorded almost no rain. The narrowness tells us something: the crop and soil behind those two probes appear to have been drawing down slowly, not swinging wide. That fits a settled dry spell more than a crop in acute stress. It is not a target range for another farm's soil or crop, and it cannot be. The sensor scale and the soil texture behind those two probes are not published, and they do not transfer.
The clear limit is this: two probes, pooled across depths, over one month, cover one small slice of the country's soils and cropping calendar. They do not stand in for a Kiambu greenhouse tomato block or a Machakos rainfed maize field. That is why this piece has deliberately not handed over a number that pretends otherwise. What the two probes do show reliably is that a settled range narrower than 20 points on the scale can be achieved and is worth aiming for as a working definition of stability. That comes after you have built your own upper and lower mark the way the earlier sections describe.
Reading the range once you have it, week to week
Once you have upper and lower marks for a crop and stage, your weekly job is comparison, not a fresh call each time. Say a shallow-probe reading drifts from the upper mark toward the lower one over five or six days, and the paired weather station records no rain. That is the ordinary case an irrigation schedule is meant to answer. But if a reading drops fast in a single day, faster than the crop's transpiration alone would explain, check the deeper probe and the rainfall on the same station before you assume the crop pulled that much water. A leak, a blocked emitter, or a probe that shifted in the soil during weeding are all more common than a real spike in crop demand.
The range also needs revisiting as the season moves, not just applying. A mark set during vegetative growth, when roots are shallow, will read as falsely dry once the crop's roots reach the deeper probe and the plant is drawing from a larger volume of soil. After each significant irrigation through the season, recheck the settled field-capacity reading. Do not assume the number fixed at planting still holds at flowering. That is more work than reading a table off a leaflet. It is also the only version of the number that was ever actually true for your field.
Where this leaves a manager deciding today
You do not have to wait a full season before a probe becomes useful. One settled reading after a good irrigation, checked against a hand-feel sample and logged with the date, already starts a working range. The mistake is treating the first number on a dashboard as a threshold. It is just the first data point in a record that needs a few more before it means anything. The products page describing NuaSense's sensor system explains how the shallow and deeper channels report alongside the weather station. That pairing, moisture against rainfall and evapotranspiration on the same ten-minute clock, is what turns a single reading into a range worth trusting.