Say your handheld meter shows 6.3 in the field. Two weeks later the lab slip comes back at 5.9. Same soil, nobody switched it. That gap comes from a chain of choices, and most were made before a probe touched the ground. Each choice shifts the number by a known, limited amount. Follow the chain in order, and what looked like an error starts to look like arithmetic.
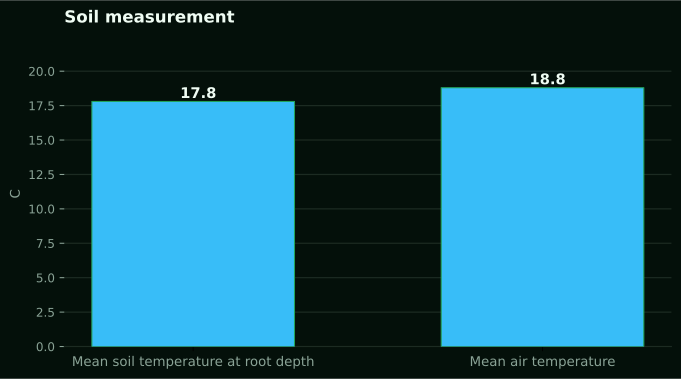
Measured by NuaSense weather stations and soil probes on Kenyan farms, over the period stated with each figure. Past readings, not a forecast.
The depth you cored decides which soil you actually tested
The Penn State soil testing guidance says to take a core 4 inches deep for lawns and 6 to 8 inches for gardens. Pull it from 8 to 10 random spots, then mix it in a bucket. A handheld meter pushed straight into the surface works differently. It samples whatever sits in the top inch or two around the probe tip. Suppose you broadcast lime on the surface and do not incorporate it, or top-dress urea recently. Then the top layer and the 6 to 8 inch layer are not the same soil chemically. The meter reading the surface will disagree with the lab reading a composite core. That disagreement is correct, because they measured different depths.
On a Kenyan smallholder block, this matters more than the guidance admits. That guidance was written for US lawns and gardens with a defined till depth. A maize or bean plot ploughed by hand or with an ox-drawn implement has no uniform tillage layer like a garden bed. And the person pushing the meter decides the depth, a choice nobody writes down. Before you compare a field reading with a lab slip, ask the honest first question: did both sample the same depth band? Not whether the instruments agree.
One core never represents a field, and the lab knows it
Penn State's protocol wants 8 to 10 locations mixed into one composite sample before it goes to the lab. A single handheld meter reading comes from one spot, because that is what a meter reading is. It has no averaging built in. Fields have patches: a spot near an old manure heap, a low corner where lime pools after rain, a strip closer to a gate where lime trucks turn. The single-point meter reading can land anywhere across that patchwork. The lab result reports the field's average. So a grower comparing one meter reading against one lab slip is not comparing like with like, unless the meter reading was itself an average of several spots walked across the block.
The lab chose a soil-to-water ratio, and that ratio moves the number
Labs in the western United States use one of three methods: saturated paste, a 1:1 soil to water ratio, or 1:2, according to the Oregon State Small Farms Program. For acidic soils, pH rises slightly as the ratio dilutes further: saturated paste reads slightly lower than 1:1, which reads slightly lower than 1:2, with the difference between water-based ratios running about 0.1 to 0.2 pH units. A handheld meter used in the field, run either as a direct soil-paste reading or against a small slurry the operator mixes on the spot, is effectively choosing its own ratio, and it is very unlikely to match whichever ratio the receiving lab runs as standard. The KBS LTER protocol fixes this at 15 g of fresh soil in 30 mL of water, a 1:2 ratio, equilibrated with the air for at least 30 minutes before the electrode goes in. If your lab uses 1:1 and your field kit effectively runs closer to a paste, a fraction of a pH unit of the disagreement is built into the method before either instrument makes an error.
Water pH and buffer pH are not the same test, and only one sets the lime rate
No matter how accurate it is, a handheld meter reads water pH. The FAO standard operating procedure for soil pH says this plainly: pH measures only the intensity of hydrogen ion activity, not the amount of acidity in the soil. Labs that recommend a lime rate run a second test called buffer pH. The University of Minnesota Extension describes it as measuring both active acidity and reserve acidity. Reserve acidity is the acidity held on soil particles that will be released as lime reacts. On nearly all soils, buffer pH reads higher than water pH. Two fields can show the identical water pH on your handheld meter and still need different lime rates. One has far more reserve acidity than the other, and the handheld meter cannot see that quantity at all. If a grower reads 6.0 on the meter and expects that number alone to say how much lime to apply, they are asking an intensity measurement to answer a quantity question.
Season moves the number by more than most growers expect
Soil pH changes through the year. The Oregon guidance records the highest pH in late winter and early spring, before fertiliser application and during periods of high microbial activity or dry soil. It notes that sandier soils can shift by more than a full pH unit between spring and the growing season. A common seasonal swing is 0.3 to 0.5 units higher in spring. West of the Cascades, the seasonal low falls near the end of the growing season, before winter rain. In irrigated eastern Oregon, it falls after spring and early summer fertilisation instead. Those two regions inside one US state land on opposite calendars for the same phenomenon. That is the point: season interacts with rainfall pattern and fertiliser timing, not with a fixed month.
A Kenyan grower who compares a handheld reading taken in September with a lab slip from a sample pulled in March is not testing the same soil condition twice. None of the sources gives a Kenyan seasonal pH curve. Inventing one would be worse than admitting the gap. If you want to know how much of a disagreement comes from seasonal drift rather than method or instrument error, the only honest fix is to resample both ways on the same day.
A dried electrode is doing more damage than any methodology gap
Oregon's program says it plainly. That handheld meter is a lab meter you can carry. It needs the same care: calibrate it, use fresh buffer solutions each time, keep the electrode in good shape. If you leave it in a truck and the electrode dries out, their words, you can't expect it to work right. Bad storage means you'll replace the electrode before the meter reads standard again. This isn't a small point. It's likely the biggest reason field readings and lab readings don't match, and it has nothing to do with method. A degraded electrode doesn't fail by chance. It drifts one way, consistently. If you haven't checked calibration against a known buffer for weeks, you won't know which way it's off or by how much.
The KBS protocol doesn't treat calibration as a one-off. Their bench method sets against pH 7 and pH 4 buffers and checks back against standards every 10 to 12 samples. Drift builds up over a run, so they recheck. Take a handheld meter across a big block, sample after sample, no recheck. It faces the same drift, with none of that discipline. If your field meter and the lab are off by the same amount on several fields, not just one, start by ruling out electrode condition. Soil chemistry comes later.
What the Arkansas comparison actually found, and what it did not
The University of Arkansas ran a national study. It compared four in-field pH methods to the average of 82 laboratories, as reported by the Oregon Small Farms Program. Of the four field methods tested, the hand-held meter came closest to that 82-lab average. That finding is narrow. Closest among field methods, yes. Not equal to the lab average. And not evidence that a handheld meter is generally more accurate than a lab result. The same study found a soil probe method couldn't tell samples apart when they were more than 2.0 pH units apart. The authors called that unacceptable for field pH estimation. A colour kit landed between the probe and the handheld meter. Its coarse 1.0-unit colour graduation limits it further, since many cropping decisions need resolution closer to 0.5 units.
This follows on from How to calibrate a soil moisture sensor on your own field, which covers How to calibrate a soil moisture sensor on your own field.
Related reading on this site: soil moisture sensors, soil temperature sensors.
The practical takeaway is narrower than either instrument's marketing. A handheld meter in good condition is the least bad field tool among the four tested. It is not a lab replacement. Oregon's guidance treats field values as estimation only. If the field reading falls outside the acceptable range for the crop you're growing, send a sample to the lab for confirmation. Kenyan growers should take the same stance: use the meter to decide if a lab sample is worth paying for. Don't use it to set a lime rate on its own.
Where liming even makes sense, and where it plainly does not
Minnesota's guidance gives a practical ceiling. About 8.4 to 8.5 is roughly the highest pH you can get with liming sources. For mineral soils, the target is 6.0 to 6.5 depending on the crop. Corn and soybean show a yield response to lime mainly below pH 6.0. Alfalfa responds below 6.5. At the other end, some soils hold so much native carbonate that you can't acidify them economically. In western Minnesota, that carbonate can run from the surface to several feet deep. A high handheld reading on such ground isn't a measurement problem to argue about. The soil is telling you liming decisions don't apply. The disagreement question is moot.
The sources don't give a Kenyan carbonate map or a Kenyan liming threshold. Don't attach any such figure to a Kenyan county here. What does carry over is the logic. Before you spend money chasing a 0.3-unit disagreement between a meter and a lab, check if the field is anywhere near a pH where liming changes an outcome. The FAO SOP's working range is 6.0 to 7.5. That's generally acceptable for most nutrient availability. Below it, aluminium toxicity risk. Above it, phosphorus lock-up. Keep the argument inside that frame.
Kenyan fields carry a different set of unknowns than the US trial plots
The Minnesota and Oregon guidance comes from managed research and extension plots. Those plots had known tillage history and known fertiliser records. A study of smallholder fields in Kenya's Central Highlands, cited in the Soil Science Society of East Africa proceedings, used soil pH as one of its diagnostic indicators. It distinguished productive from non-productive smallholder fields. A reminder that pH variation between adjacent plots on the same hillside can be real and large, not a measurement artefact. Separately, a study of farmers' perceptions of soil quality, from Embu University's repository, looked at how growers read soil condition and manage fertility on their own fields. That work sits closer to how decisions actually get made than any lab protocol does.
Neither source puts a Kenyan figure on how often meters and labs disagree, and we shouldn't invent one. But both show that pH can vary from field to field on Kenyan smallholdings. It is a real, documented pattern, not random variation you can average out. That sets a higher bar for how many spots in one field you sample before a meter reading or a lab composite tells you anything. It echoes the multi-core approach Penn State uses in its own protocol.
What a soil moisture and temperature record can and cannot tell you here
NuaSense's deployed field sensors don't measure pH at all. The shallow and deeper probes report moisture as a percentage of sensor scale and soil temperature at each depth. For pH, a location relies only on the modelled iSDA and SoilGrids baselines, fetched once when a station first reports its position. That's a map estimate from roughly 2016, not a test of that particular field. That distinction matters directly to this argument: the earlier piece on percent of scale versus volumetric water content makes the same point for a different reading. A sensor's own number and a lab-style calibrated figure aren't interchangeable just because they share units. The same caution applies when a pH map figure stands in for an actual soil test.
An ongoing probe record does help with timing. Soil temperature and moisture move with rainfall and drying cycles. Oregon guidance links pH swings to those same wetting and drying cycles, and to spells of dry soil or high microbial activity. If a farm keeps continuous soil moisture logs, like the ones on the NuaSense products page, it at least has a record of which weeks were wet and which were dry. That is the context missing when you need to judge whether a pH disagreement between two sampling dates is real seasonal drift or something else.
What to actually do before you spend money on lime
Settle the depth question first, and say it out loud. Pick a sampling depth that fits the crop's root zone, then use it for every core, every time, on that field. Take at least the 8 to 10 cores Penn State recommends and mix them. Don't trust one meter poke anywhere on the block. If you use a handheld meter, check the electrode and refresh the buffer solutions before that day's readings, not once a season. A single field reading is a screen, not a verdict. Oregon guidance says send a sample to the lab whenever the field reading falls outside the acceptable range for the crop; that's a sound default here too.
Ask the lab what soil-to-water ratio it uses, and whether the number it sends back is water pH or buffer pH. Only the buffer figure, where the lab provides one, has any bearing on a lime rate. Don't lime on a single water-pH reading by itself. And don't expect a handheld meter, no matter how well maintained, to answer a reserve-acidity question it was never built for. If a field sits well outside the workable pH range because of strong native carbonates or extreme acidity, spend the money to confirm that first. Liming a field that can't economically be moved is the one failure no calibration can fix.
The failure modes worth naming plainly
Most disagreements between a handheld meter and a lab slip trace to one of a small number of causes. They are worth listing, because each has a distinct fix, unlike a single blended
- Different depths sampled: surface probe reading against a composite 6 to 8 inch core
- Single spot against a multi-core composite: one meter poke against 8 to 10 mixed cores
- Mismatched soil-to-water ratio between the field method and the receiving lab's standard method
- Water pH quoted where a buffer pH was needed to set a lime rate
- Seasonal timing: readings taken weeks or months apart on soil whose pH genuinely moves with wetting and drying cycles
- A degraded electrode or expired buffer solution drifting the meter consistently in one direction
- A soil already near the practical liming ceiling or floor, where the disagreement is real but irrelevant to the decision
None of these causes is exotic, and none means you have to distrust either instrument as a matter of principle. The EPA's electrometric pH method notes that detailed operating procedures cannot be written into one standard because pH meters and accessories vary so widely. That is really an admission that the operator's discipline, not the device on the shelf, decides most of the outcome. Work down this list before you assume either number is wrong.