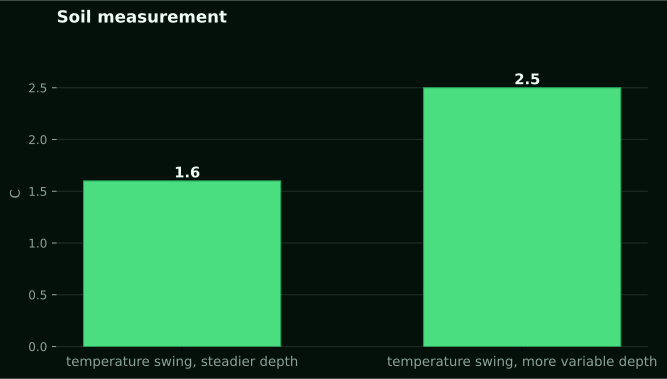
Soil moisture depth after rain is the reading that surprises people first. Across our own network, soil moisture averaged 75 percent of sensor scale over a month spanning the tail of August into September 2026. The average pooled both probe depths on three installations. Pooled is the operative word. Split by depth, the two behave nothing alike after rain falls. Soil temperature at the same sites moved through 1.6 degrees Celsius at the steadier depth and 2.5 degrees at the more variable one over the same stretch. That is a factor of about 1.6 between them. Temperature swings less at depth because heat has to conduct downward through soil that is a poor conductor. Moisture, when rain arrives, tells the same story from the other direction. The front has to physically travel through pore space before the deeper sensor even registers it.
That lag is the whole subject of this piece. Not whether it rained, not how much, but how far down the water actually reached, how long that took, and what the deeper probe needed to see before it moved at all.
The soil column does not fill like a bucket
The Nebraska Extension work on spring rainfall and available soil moisture sets out the mechanism cleanly with a worked example. It was measured on Nebraska cropland, not Kenyan soil. In their coarse-textured example, each foot layer had to reach its own storage capacity before the surplus moved down to the next. On Day 1, 1.5 inches of rain fully recharged the top layer and only 0.5 inch passed through to the layer below. On Day 2, a heavier 3.0 inches of rain finally pushed moisture all the way down through five feet, with another 0.5 inch moving further. By Day 3, 1.0 inch of additional rain was pure surplus because every layer was already full.
Run the same logic on their heavier soil example and the numbers change but the shape does not: 1.5 inches on Day 1 left the top layer half an inch short of capacity, and 3.0 inches on Day 2 still left the third layer short. Heavier soils hold more water per foot, so they take longer to fill, and a given storm goes less far down. None of these inch figures are Kenyan. What transfers is the principle: water does not move downward until the layer above it is satisfied. On a Kenyan block with two probe depths, that principle explains the shallow reading. It jumps on the first afternoon of rain while the deeper one can sit flat for a day or more, sometimes longer, depending on how dry the profile was before the storm and how much rain fell.
Why the deeper probe needs more than a passing shower
A dry profile absorbs the first rain almost entirely near the surface. This is exactly the mechanism the Nebraska rainfall recharge work shows layer by layer. It is also why a single light shower can wet the top few centimetres and do almost nothing below. The practical marker most extension guides reach for is a tile probe. It is a solid metal rod pushed into the ground. It slides easily through moist soil and meets noticeable resistance the moment it hits dry soil. The Utah State Extension guidance on monitoring irrigation with probes recommends checking with a tile probe 1 to 2 hours after irrigation specifically to see how far the water travelled. It notes that frequent, short irrigation cycles commonly wet soil to only 2 to 3 inches, while a heavier, less frequent application can push the wetting front to 24 inches for deep-rooted plants.
That is irrigation, not rain, and it was measured on landscape and garden soils in the United States, not on a Kenyan maize or bean block. But the resistance test itself is not tied to any location. A tile probe reads mechanical resistance, nothing else. It tells you where the wet soil stops. It does not tell you how much water is in that wet layer, and it is not a substitute for a calibrated moisture sensor. If you own one and you want a quick check after a storm, push it in at several points across the field, not just once at the gate, because wetting is rarely uniform even within one block.
What our own sensors add that a probe rod cannot
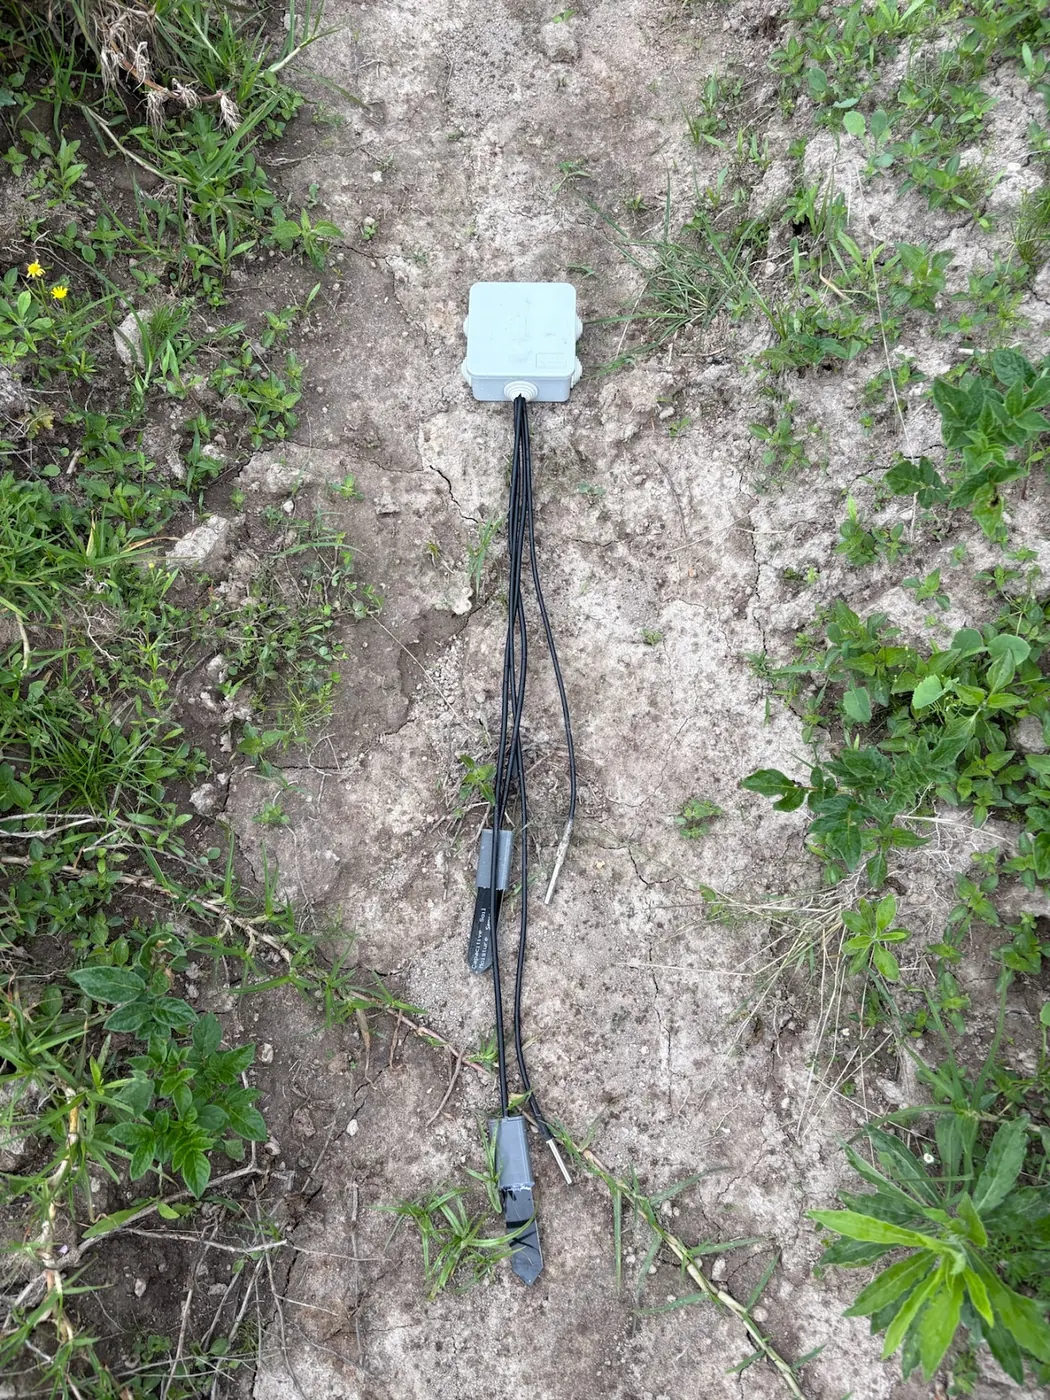
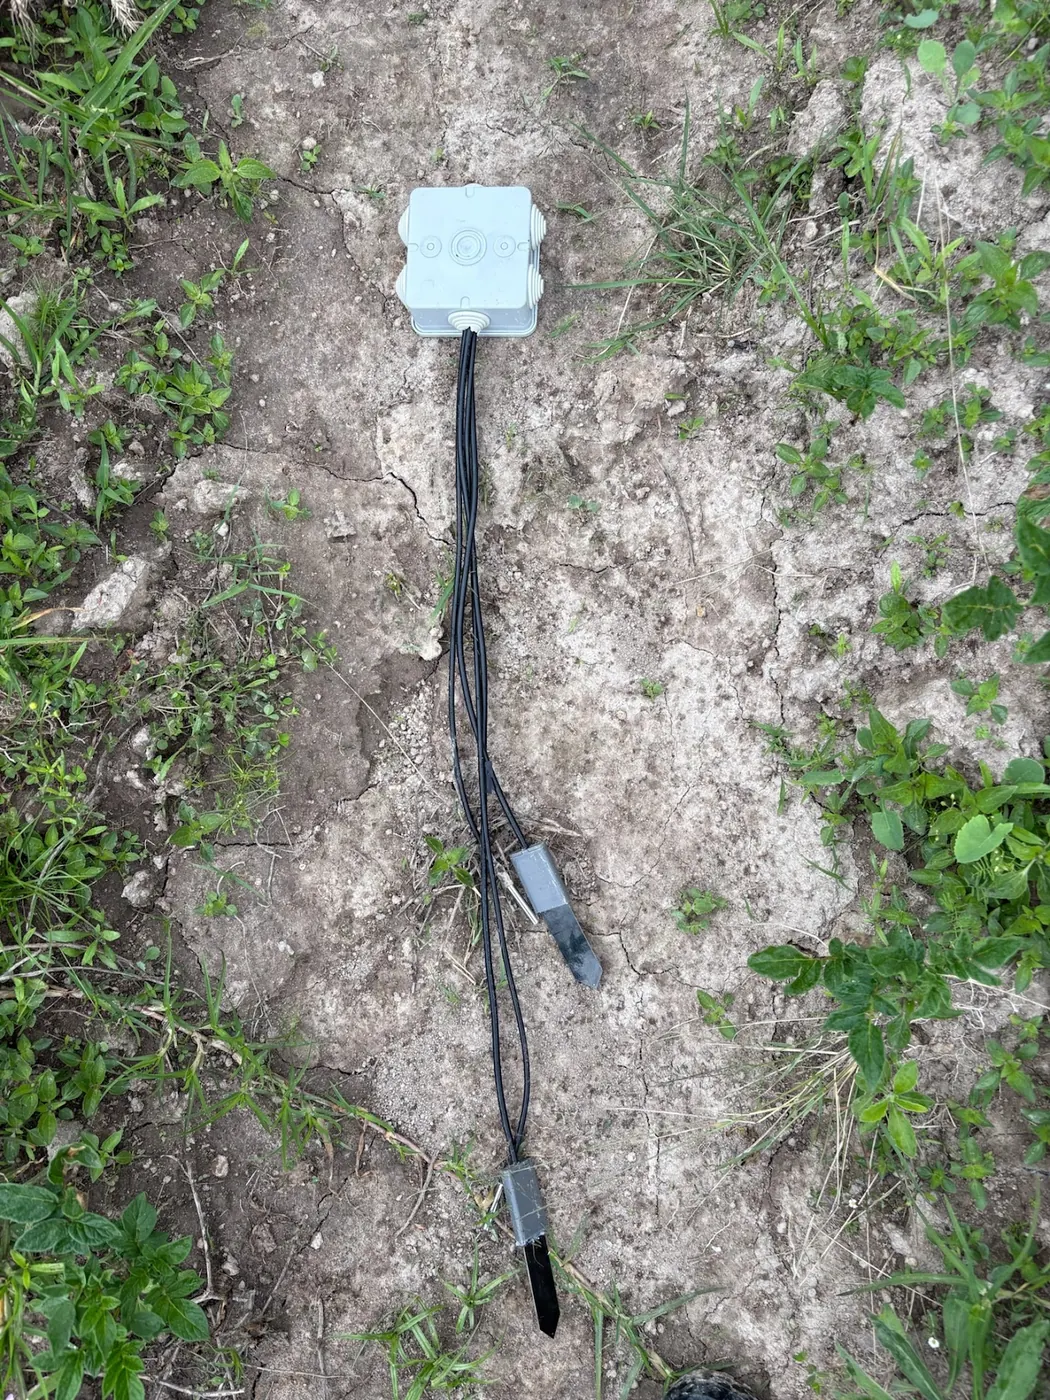
Our deployed soil sensors report relative moisture as a percentage of sensor scale at two depths, roughly every ten minutes, over LoRaWAN through the weather station on the same mast. A tile probe tells you where wet stops. A logged reading at two fixed depths tells you when the front arrived, not just where it ended up, and it keeps doing that for every storm afterward without you walking the field each time.
The eastern Kenya work gives a real millimetre number
Most of the mechanism above comes from soil physics measured abroad. Kenyan evidence exists too. It is rare, so it is worth naming. A study using precipitation data to identify soil moisture patterns in eastern Kenya used a 10 mm soil moisture threshold at each monitoring station to mark the start, end and duration of the rainy season. That is a concrete number tied to a real place. It is worth remembering exactly because it is not a universal rule, only the threshold that one study chose for its stations. The same work found that the short rains season runs longer, more reliably, and wetter than the long rains for stations south of the equator in eastern Kenya. The reverse holds for stations north of it. That north-south split inside one region is easy to miss if you assume rainfall behaves the same way across a county boundary.
What this means for a probe reading is straightforward. If you are deciding whether a storm started your rainy season or was a false start, a fixed depth reading crossing some threshold is a far steadier signal than counting days since the first drops fell. That holds even for a rough threshold you set for your own field. The 10 mm figure from that study is not something to copy onto your own dashboard verbatim, since it was tuned to those stations. But the logic behind picking a threshold and watching for it is transferable.
Terracing changes how far the water gets before it disappears
A separate piece of Kenyan work matters here for a different reason. A study on hard-setting soils in semi-arid eastern Kenya compared terraces built with ditch depths of 60 cm, 30 cm and no ditch at all. Both the 30 cm and 60 cm ditches held more soil moisture than the flat control, across every slope position and season tested. The study's own recommendation favoured the shallower 30 cm ditch for hard-setting soils in that semi-arid zone, on the reasoning that it conserved moisture and nutrients without the extra excavation the deeper ditch demanded.
The relevance to a probe reading is direct. On a hard-setting soil with a crust that sheds water fast, a shallow probe reading after rain can look deceptively low. That happens even when a real amount of rain fell, because much of it ran off before it had a chance to infiltrate. If your field is terraced, or you are deciding whether it is worth the labour to build a shallow ditch, the deeper probe's response over the following day is a better test than the total rainfall figure alone. It shows whether the terracing is doing its job. Two fields catching the same storm can show very different depth profiles depending entirely on how much of that rain stayed rather than ran off.
Sand, clay and why the same rain wets different soils to different depths
Available water holding capacity is the number that decides how far a given rainfall travels. It varies by texture more than most growers expect. The Nebraska Extension tables list fine sandy loam, silty clay loam or clay loam at 1.8 inches of available water per foot, and loam or silt loam over silty clay subsoils at 2.0 inches per foot. Sandier soils generally hold less and let water pass more quickly to depth. Heavier clay soils hold more per layer but take longer to satisfy, meaning the same rainfall wets a shallower column. These figures are American measurements on American soil series and should not be copied onto a Kenyan farm plan. What does transfer is that texture, not rainfall total alone, sets the depth a storm reaches. Two neighbouring fields with different topsoil can show differing wetting depths from the identical rain event.
This is also where smectite clay is worth knowing by name, if your soil has it. The Nature Scitable overview of soil science notes that smectite clays shrink and swell so strongly on wetting and drying that they can move buildings. A field with heavy smectite content behaves oddly for a probe reading too. Cracks that opened during a dry spell let the first rain travel down fast through the crack network before the clay swells shut. After that, the same soil resists further infiltration almost completely. If your deeper probe jumps unusually fast on the very first storm of the season, then goes quiet on the next one, cracking clay is a plausible explanation worth checking against what you know of the field.
This follows on from Soil moisture readings: the three numbers you need to read them, which covers Soil moisture readings: the three numbers you need to read them.
Related reading on this site: soil moisture sensors, soil temperature sensors.
This follows on from what to measure in the drain water of a soil greenhouse. That piece worked out where water goes once it moves past the root zone rather than into it.
Field capacity and tension, the distinction that changes what a reading means
Soil moisture content is how much water is present. Soil moisture tension is how tightly the soil is holding onto that water. They are not the same measurement, and conflating them is a common mistake. The Oregon State Extension guide to soil moisture monitoring puts field capacity at roughly minus 10 to minus 33 kPa of tension, depending on texture, and gives a worked example: a volumetric water content of 0.25 cm3/cm3 in a 12-inch root zone equals 3 inches of stored water. A percentage on its own tells you nothing about whether that water is available to roots or held so tightly by clay particles that a plant cannot pull it out. Two soils can report the same water content and behave completely differently at the root.
Our own soil sensors report relative moisture as a percentage of sensor scale, not calibrated volumetric water content. Readings of 60 to 85 are normal on that scale. It is not the same number as Oregon's 0.25 cm3/cm3, and converting between them without a proper calibration curve would be inventing a figure that does not exist. What the sensor scale is good for is tracking change over time at a fixed point: whether this storm moved the deeper probe more than the last one did, and how quickly the shallow probe drains back down afterward. That relative comparison is where the value sits. Not in treating any single percentage as an absolute quantity of water.
The hand feel method, and where it still beats a sensor
Before probes and sensors, agronomists worked out moisture by feel, and the method is still taught for a reason. The Iowa State Extension guide to evaluating soil moisture in the field describes pulling samples with a hand probe at each one-foot depth through the active root zone. Moisture is judged from how the soil balls, ribbons or crumbles in the hand. Done by an experienced operator, feel and appearance can estimate volumetric moisture within roughly 5 to 10 percent, according to the same body of extension guidance summarised at Oregon State. That is closer than many growers assume, and it costs nothing beyond the time to dig.
Where feel loses to a logged sensor is frequency and memory. A hand sample tells you the state of the soil at the moment you dug it, once. A buried sensor reading every ten minutes tells you exactly when the deeper layer responded to a storm relative to the shallow one. It does that without you standing in the field at 3am to watch it happen. For a one-off check before a planting decision, hand feel is free and good enough. For understanding how a whole rainy season moves water through your specific field over weeks, it is not the right tool, because nobody digs a hole every ten minutes.
Gypsum blocks: cheap, but with a real limitation
Gypsum blocks are the cheapest fixed-point moisture monitoring option most growers will encounter. The Iowa State guidance sets out how they are meant to be deployed. Roughly one block per foot of soil depth through the root zone, with at least four monitoring stations per field. On sloped ground, stations go at the top, middle and bottom, spaced 100 to 150 feet from either end. That is a real, field-scale monitoring layout, not a single point reading.
The same source is direct about the limitation. Gypsum block accuracy suffers under saline and dry conditions, and the block needs good, continuous contact with the surrounding soil to read correctly at all. On a saline field, or through a dry spell when contact with shrinking soil can loosen, the numbers become unreliable exactly when you most want them to work. For a grower deciding between gypsum blocks and a logged electronic probe, the honest answer depends on soil chemistry as much as budget. On non-saline ground, where you are willing to install four or more stations properly, gypsum blocks are a legitimate low-cost option. On saline or intermittently very dry ground, they are the wrong tool regardless of price. A logged sensor earns its cost through reliability, not convenience alone.
What a logged two-depth sensor actually buys you
A NuaSense soil sensor costs from KES 7,000 for the base two-channel version up to KES 10,000 for the variant that also reads EC, excluding tax. It reports through the weather station on the same mast rather than a separate gateway. That is not a small outlay next to a free hand-feel check, and it is not the right purchase for every farm. If your main question is a single yes-or-no before planting, a hand sample answers it for free. So does a tile probe, where you have one, pushed in an hour or two after rain. Where the sensor earns its price is the pattern over a season. Whether the deeper probe consistently lags the shallow one by hours or by days after a given storm size. And how much rain it actually takes, judged from that lag on your own soil, before roots at depth see any benefit at all.
That kind of season-long pattern is also the argument made in our earlier piece on replanting maize after a burnt field. That piece worked through when a soil reading is worth more than guessing from the calendar. The logic carries over directly. A single storm total from the Kenya Meteorological Department or a satellite product tells you what fell from the sky. It does not tell you whether that rain reached the depth your crop's roots actually sit at, and only a reading taken in the ground, by hand or by sensor, answers that.
Where this leaves the weather station reading itself
The two numbers get conflated constantly, so be clear about what a rain gauge total can and cannot do here. Our own network recorded rainfall totals ranging from 0.4 mm to 104.4 mm across four stations over the same month. That spread is wide enough that no single station total describes a region, let alone a specific field kilometres away. Only 1.8 percent of ten-minute readings across the network carried any rain at all in that period. Most of the season's rainfall arrived in a small number of concentrated events, not steadily. A gauge tells you how much fell at that mast. It says nothing about how far down it went on your particular soil. That is exactly the gap a buried probe closes and a rain total alone cannot.
Long-term context matters too, though it should be read as history, not forecast. The CHIRPS satellite rainfall record for the grid cells our stations sit in averages 35 mm for September across 43 years, ranging from a dry 5 mm in 1997 to a wet 79 mm in 2020. That is a description of what has happened, not a prediction of what will. Whatever September brings this year, the only way to know whether it wet your root zone is a reading taken in the ground itself.
What to change on Monday
If you already have a two-depth probe installed, the practical move after the next real storm is simple. Note the time the shallow reading moves. Note the time, or whether the deeper one moves at all, and write both down against the rain total from the same event. Do that across two or three storms of different sizes. You will have something no single extension bulletin can give you: your own field's lag, on your own soil, at whatever depth you buried the probe. That is the number this whole piece has been circling, and nobody can hand it to you from Nebraska, Utah or Iowa. You have to read it off your own ground.
If you do not have a probe yet and are deciding whether one is worth buying, the honest answer turns on what decision you are actually trying to make. A single check before planting is answered well enough by a hand sample or a tile probe rod. Both are essentially free. A season-long question about how reliably rain reaches your root zone, especially on a field with mixed texture or known salinity, is what the logged sensor is for. The KES 7,000 to 10,000 outlay is priced against exactly that kind of repeated, unattended reading rather than a one-off check.
NuaSense has a longer piece on this. Growing beans in Kenya, practical guide for farmers covers Learn how to grow beans profitably in Kenya. This practical guide covers variety selection by region, planting times, pest and disease control, storage tips, and selling strategies. It helps farmers boost yields from 0.6 to over 1.5 tonnes per hectare.