A soil moisture sensor does not measure water. What it measures is how the soil around it responds to an electrical field. Water just happens to be the thing that changes that response most. The number you see on a dashboard is the end of a chain of conversions, and somewhere in that chain the units stopped being physical.
The number on its own cannot tell you whether to irrigate. It can only tell you where you are between two limits, and those two limits are properties of your soil, not of the sensor. That gap explains most of the frustration we hear from growers who bought moisture sensors and stopped using them.
What the sensor is actually doing
Almost every affordable field sensor uses a capacitive probe. These probes exploit a large contrast in dielectric permittivity. Dry mineral soil sits somewhere around 2 to 6. Water sits near 80. Push an oscillating field through the soil, watch how the circuit responds, and the result tracks water content closely enough to be useful.
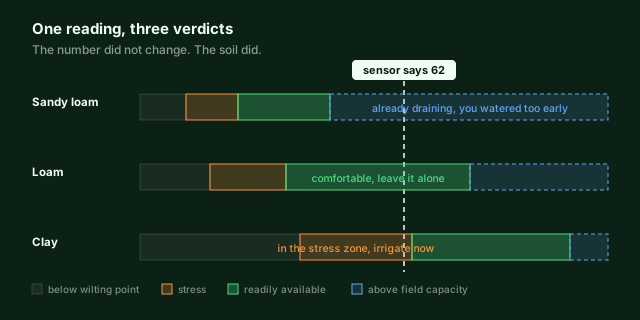
Closely enough is doing a lot of work in that sentence. The response also shifts with soil texture, bulk density, temperature, and salinity. A probe reading 62 in a sandy loam and a probe reading 62 in a heavy clay are not reporting the same amount of water. Neither of them is reporting volumetric water content unless somebody calibrated them against gravimetric samples from that specific soil.
There is a quick sanity check you can run on any dataset. Mineral soils saturate somewhere between roughly 40 and 55 percent volumetric water content, because the rest of the volume is solid particles. If your sensor is reporting values in the seventies and eighties, it is reporting percent of its own scale, not percent of soil volume. That is a legitimate way to run a sensor. It just is not the thing people assume they are looking at.
The first two numbers: field capacity and wilting point
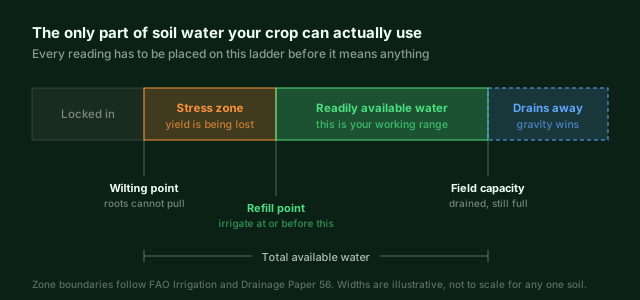
After heavy rain or a full irrigation, soil drains for a day or two and then stops. What it holds at that point is field capacity. Water above it cannot be held against gravity and leaves, taking dissolved nitrogen with it. At the other end, there is a water content below which roots can no longer pull quickly enough to keep up with transpiration. That is the wilting point. The gap between the two is the total available water, and FAO Irrigation and Drainage Paper 56 is where the standard definitions and the arithmetic come from.
Texture moves both limits. A sandy soil might hold 80 mm of available water per metre of root zone. A silty clay loam can hold more than twice that. This is why the same reading produces different decisions on two farms a few kilometres apart, and why a threshold copied from an agronomy blog written for Nebraska will quietly mislead you in Nyandarua.
Those two limits are not fixed forever either. Compaction, organic matter loss and erosion all reduce how much water a soil can hold, which means field capacity itself drifts downward on a degraded field and last season's threshold slowly stops being right. NuaSense covers what is driving that in Kenyan conditions, from land pressure and residue removal through to the climate interaction, in declining soil health in Kenya.
The third number: how far you are willing to let it fall
Irrigating at wilting point is too late. You have lost yield by then. FAO-56 uses a depletion fraction, called p. It is the share of total available water a crop can surrender before stress begins. Take p times total available water, and you get readily available water. That is the range you actually work with.
Under moderate demand, p sits near 0.5 for many field crops. That means you refill once roughly half the available water is gone. Shallow-rooted vegetables need a smaller p. Deep-rooted crops with low sensitivity can take a larger one. When evaporative demand is high, p drops, because the plant wants water faster than the soil can hand it over. In the Rift Valley on a hot windy afternoon, the same soil at the same moisture content is a tougher spot for a plant than it was at dawn.
Once you have those three numbers, the sensor reading finally becomes a decision. Not before.
When to irrigate is only half the job. How you deliver the water decides if the refill reaches the root zone or runs off the surface. The NuaSense overview of smart irrigation in Kenya covers drip and micro systems on smallholder plots and solar-powered pumping that works around unreliable grid access. It also looks at why adoption tends to stall on cost and local manufacturing rather than on the technology itself.
Getting field capacity without a laboratory
You do not need a lab to make this practical. You need one wet-up and some patience.
- Irrigate a small area past saturation, ideally after a harvest so nothing is drawing water.
- Cover it with plastic sheeting so evaporation cannot confuse the picture.
- Watch the sensor. It will spike, then fall steeply, then flatten. Sandy soils flatten within a day, clays take two or three.
- The value where the curve flattens is field capacity on your scale, at that depth, in that soil.
Wilting point is harder to pin down honestly, and most growers never measure it. A practical substitute: note the reading when the crop first shows afternoon stress and does not bounce back overnight. Treat that reading as the floor you never go below. It is not the textbook value, but it is yours. It comes from your field, not from a table.
One caveat needs saying plainly. Low-cost capacitive sensors drift, and the published work on them does not hide how big that problem is. A 2025 calibration study in Sensors found that reliable results required soil-specific calibration. It also found that accuracy held only with recalibration every three to four months. If you set your thresholds last season and nobody has checked since, they are probably not the thresholds you think they are.
Run these three tests on your own data. Range: if the maximum is exactly 100, you are looking at percent of scale. Physics: any mineral soil reporting above 55 percent volumetric water content is not reporting volumetric water content. Coverage: count readings per day against the expected interval. Averages built on days with 90 percent packet loss are not averages, they are noise.
One depth will lie to you
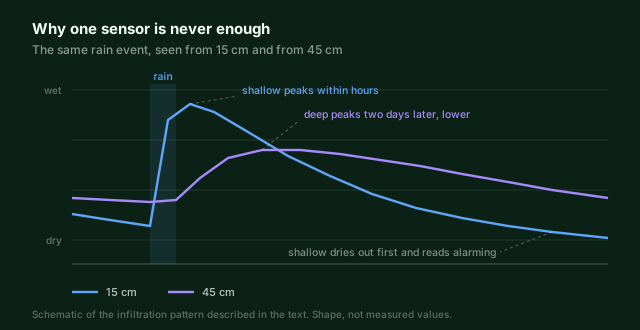
One probe at 15 cm measures the layer that reacts fastest to everything and holds nothing. It jumps within hours of rain, and it dries first under sun and wind. If you read it alone, you will irrigate on days the crop did not need water, because the root zone below still had reserves.
Two depths turn that noise into information. If the shallow probe rises and the deep one does not, water did not get past the top layer. Usually that means the event was too small or the surface sealed. If both rise together, the wetting front reached the root zone. If the shallow probe falls well below the deep one during a dry stretch, the crop has started drawing from depth. You have more time than the top sensor suggests.
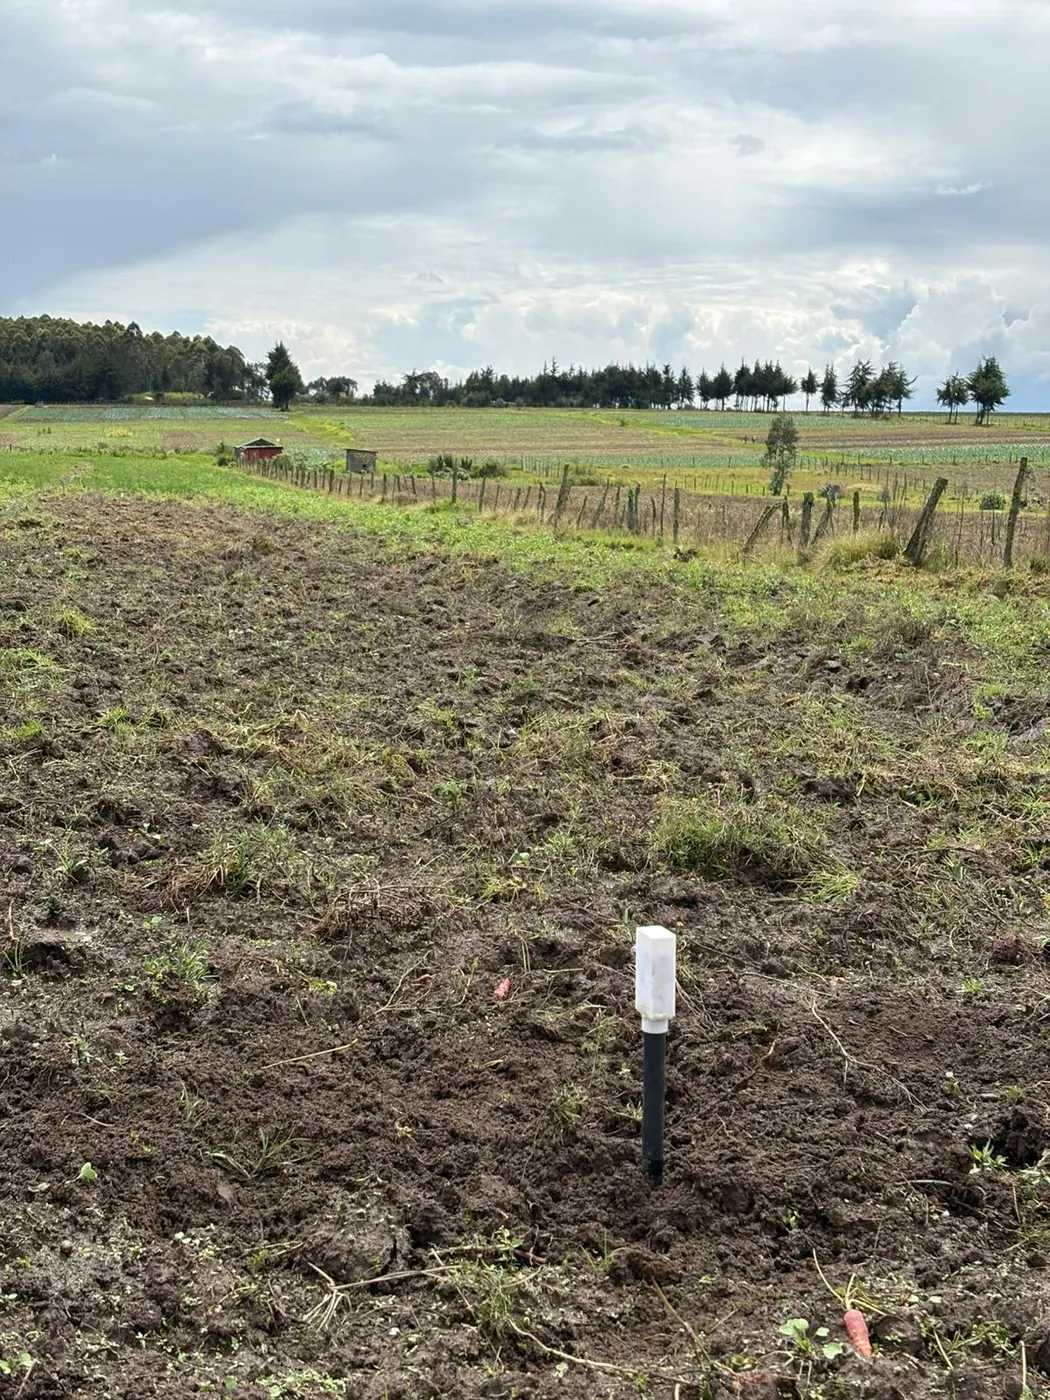
Placement matters as much as depth. Set probes where the crop is representative. Do not put them next to the tap, in the wheel track, or in the one patch that always looks worst. Two probes in a uniform block beat six scattered across soils that behave differently. With two, you can average them and know what you averaged.
What to do this week
- Find out whether your sensor reports percent of scale or calibrated volumetric water content. If nobody can tell you, assume it is percent of scale.
- Establish field capacity on your own soil with one wet-up and a sheet of plastic.
- Write down the reading at which you will irrigate, and the depth it refers to. A threshold without a depth is not a threshold.
- Add a second depth in at least one block before you add a second block.
- Put a recalibration date in the calendar for three months out.
You don't need fancier gear for any of this. What you need is to anchor the sensor to two limits from your own field. That's about an afternoon of work, and it holds up for several seasons. Want the mechanics of the measurement? We cover them under soil moisture, soil temperature and electrical conductivity. And if you'd rather have someone set the baseline with you on site, that's part of what NuaSense does during installation.
The depletion fraction is also where soil data starts talking to weather data. Why? Because p moves with evaporative demand. That's the subject of the next piece.