We stopped last time at the depletion fraction. That is how much water a crop can pull from the soil before yield starts to suffer. That number shifts with evaporative demand. Now we pin down evaporative demand: how many millimetres your crop lost yesterday, and how you turn that figure into a depth of irrigation water to put back.
The term for this is evapotranspiration. It combines evaporation from the soil surface with transpiration through the crop. Agronomists shorten it to ET. For scheduling, you need the crop-specific form, ETc. The math is simple: ETc = ET0 × Kc. ET0 is reference evapotranspiration, a measure of atmospheric demand for a standard grass surface. Kc is the crop coefficient, a multiplier that adjusts for your crop’s growth stage and canopy cover. Subtract any effective rainfall that fell, and what remains is the depth you need to apply.
ET0 in Kenya: why a single national number is useless
Reference evapotranspiration changes a lot depending on where you are and what time of year it is. A study comparing two Kenyan stations shows this clearly. At Voi, an arid lowland, the March peak is 175.3 mm. That works out to roughly 5.7 mm per day (175.3 ÷ 31). Kitale, a humid highland, peaks at 157.1 mm in March, about 5.1 mm per day. In June, Kitale falls to 121.5 mm, a daily average of 4.1 mm. Two different comparisons come out of that. They are different questions. First, in March, when both stations are at their peak, Voi asks for about 12 percent more than Kitale (175.3 / 157.1 = 1.12), for the same crop on the same day. Second, Kitale alone moves 23 percent between its March peak and its June low (121.5 / 157.1 = 0.77). That is the same block asking for a different depth three months apart.
A single ET0 figure for the whole of Kenya could be off by over 50 mm in one month. Put Voi’s March high of 175.3 mm next to Kitale’s June low of 121.5 mm. A blanket number misses half the truth. Both sets of numbers were calculated with the standard FAO‑56 Penman‑Monteith equation, on daily data from 2000‑2009. So the difference is purely climatic, not methodological.
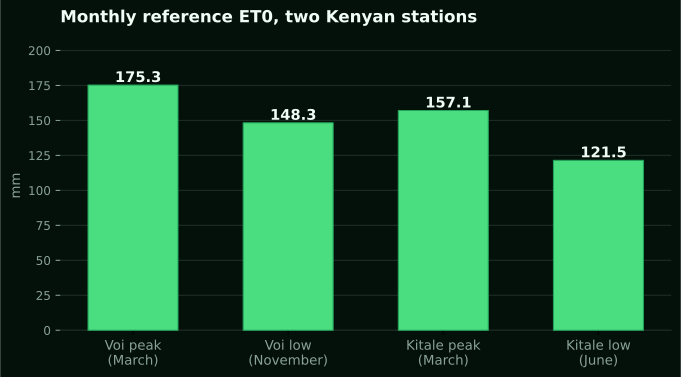
Reference evapotranspiration for two stations, FAO‑56 method, 2000‑2009. Voi is arid lowland; Kitale is humid highland.
The crop coefficient: where the table ends and your block begins
Take your local ET0 and multiply it by the crop coefficient. That gives you ETc in mm per day. The FAO‑56 manual has a table of Kc values by crop and growth stage. It splits them into initial, mid‑season, and late‑season stages. Find your crop and its current growth stage in that table, and start with the value you find there.
Then treat it as a rough starting point. The coefficients in the table were derived for a standard climate: sub‑humid, wind speed of 2 m/s, minimum relative humidity 45%. Most Kenyan blocks do not see that combination. When you apply a default Kc without adjustment, the error can be large. A USDA review of published studies found that the FAO‑56 initial‑stage Kc sometimes deviates by as much as 200% from the value you would get by calibrating to your own conditions, a finding it traces to Allen and DeWalle in 2009. That is not a rounding error. It is the difference between a schedule that tracks the crop and one that quietly runs on a number from somewhere else.
Mixing coefficients from older FAO‑24 studies with modern FAO‑56 ET0 values is another trap. FAO-56 Chapter 6 puts the overestimate of the older method at up to 25 percent under high wind and low humidity. So a Kc derived from FAO‑24 will systematically mis‑schedule if you plug it into a Penman‑Monteith ET0. If you are not certain which method a coefficient came from, you are safer looking up the current FAO‑56 table and adjusting from there.
Subtract effective rainfall to get the actual irrigation need
Not all rain counts. Effective rainfall is the portion that infiltrates the root zone and is not lost to runoff, deep percolation or evaporation from wet leaves. The FAO Irrigation Manual Module 4 provides formulas to estimate it. In practice, for a given day, you take ETc and subtract any effective rain that fell since your last irrigation. What is left is the net irrigation depth you must replace. If the effective rain exceeds ETc, the surplus stays in the soil profile.
That is why you need to track soil moisture between irrigations; it is not optional. Skip it and you are only guessing when the stored water runs out. Our probes report relative moisture as a percentage of sensor scale, not volumetric water content. As we covered in an earlier post on reading a moisture number, once you have calibrated for field capacity and wilt point on your block, the depletion curve gives you a direct check on your ETc estimate.
What to do when the table Kc is wrong
Keep an eye on the soil moisture curve. That is the most practical defence. If it consistently shows the crop drying the soil faster than your schedule predicts, your Kc is probably too low. If the curve never dips before the next irrigation, your Kc is too high. Which way the error leans tells you whether to raise or lower the coefficient.
If you want a more rigorous approach, calibrate Kc for your own area. A 2003 study from Kenya showed how to derive dual crop coefficients from satellite imagery for water allocation planning. It starts from the dual coefficient described in FAO‑56, which separates basal crop transpiration from soil evaporation. What the study adds is a way to derive those terms from imagery rather than from a table. Similar remote sensing adjustments have been tested in other climates, such as a study of squash in Portugal's Lis Valley. None of them give you a ready‑to‑use number, though. They show you the route; you still have to walk it on your own block.
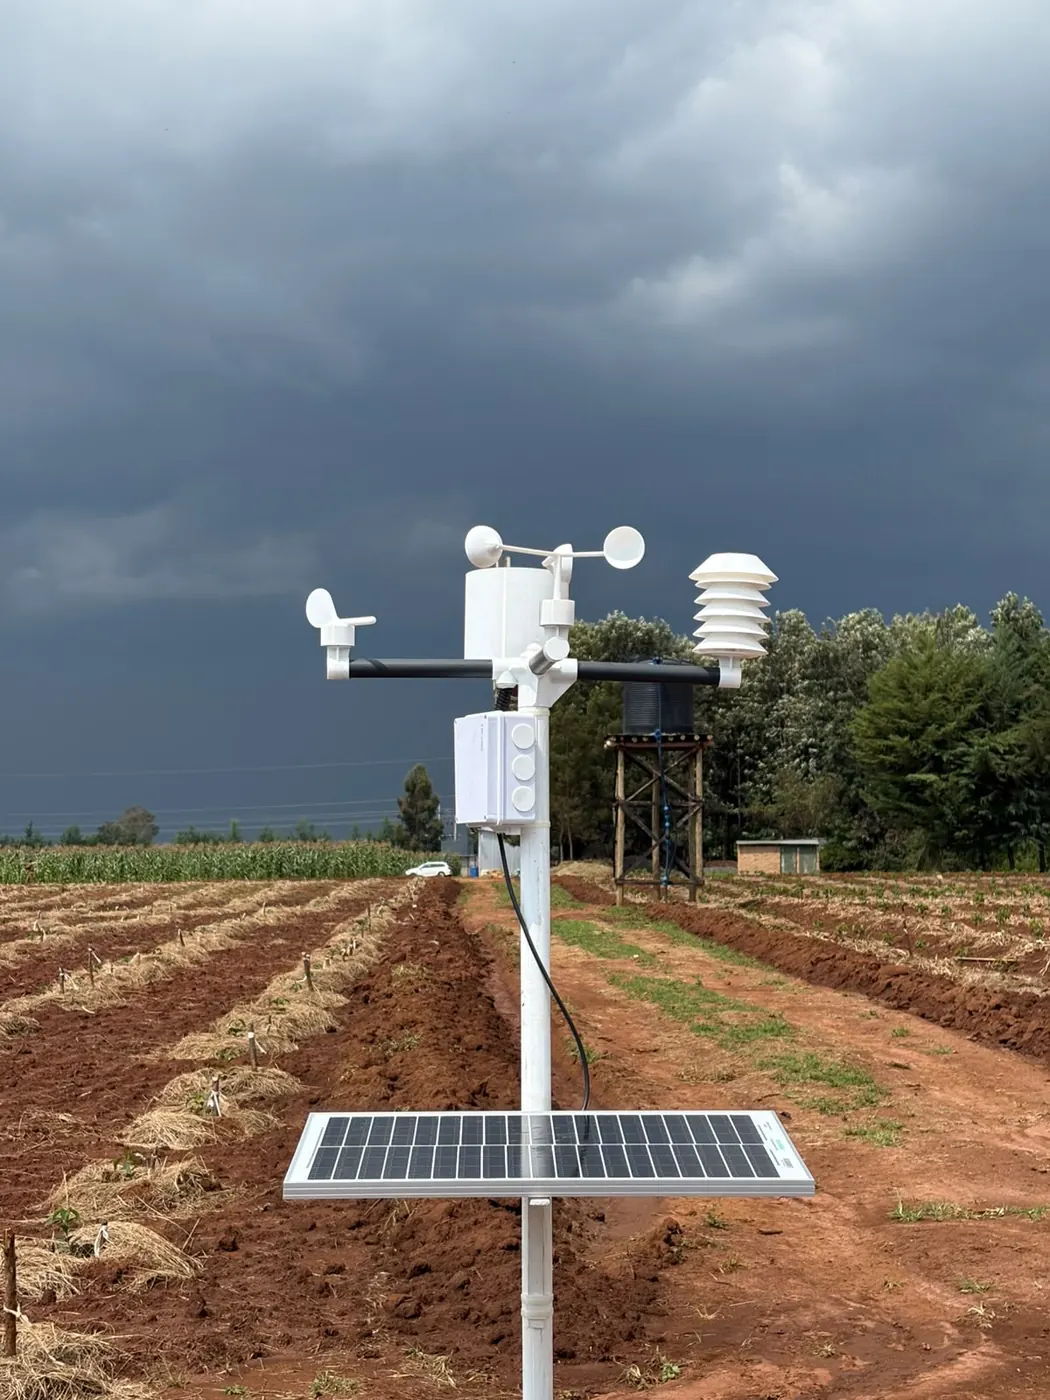
The FAO's WaPOR portal is another option. WaPOR version 2 publishes at three levels: 250 m for regional work, 100 m, and 30 m at level 3, with a latency of two days. Actual evapotranspiration is published dekadally. For many blocks, that is enough to correct a book value. If that cadence is too slow for how you irrigate, use an on-farm weather station. A measured local ET0 removes the guesswork that a regional product leaves in.
The arithmetic, start to finish
Begin with the FAO‑56 crop coefficient for your crop and growth stage. Find it in Table 12 of the manual. Then adjust it. You cannot read the direction of that adjustment off the table, and nobody has published it for your block. What the table does tell you is the climate it assumes: sub-humid, 2 m/s wind, 45 percent minimum humidity. Work out how your own block differs from that. Nudge the coefficient, then let the soil moisture readings tell you whether you nudged the right way. The readings, not a rule of thumb, tell you whether the adjustment went the right way.
Take that local Kc and multiply it by your daily ET0 from the best source you have: a nearby weather station, WaPOR, or your own pan. The result is the crop's water loss in mm. Subtract any effective rainfall that fell, and that gives you the net depth to replace. The FAO Irrigation Manual Module 4 walks through the arithmetic step by step. It also covers how to account for soil moisture already in the profile, and how to convert a net depth into a run time using your system's application rate. But always start with an honest evapotranspiration number. If that number is wrong, everything that follows is waste, either water or yield.
To learn more about the technologies that can deliver this data, see NuaSense’s overview of smart irrigation in Kenya. It explains why drip and micro‑irrigation have been adopted on smallholder plots and where costs still block uptake. If you are still working out when to plant, the post on Kenya’s planting cycles lays out the long and short rains by region and how the windows are shifting.